empty
30.11.2022 11:05 AM
Ethereum consolidated above $1,200 key level: is the path to $1,500 open?

The events of November finally plunged the market into an abyss of fear and mass capitulations. According to a report by Glassnode, whales sold more BTC and ETH coins in November. A similar position was taken by miners because of the enormous losses.

Despite this, investors continue to believe in cryptocurrencies and actively increase their investments. Analysts at Santiment note that euphoric moods have peaked in the last three months.

First of all, this can be seen in the "shrimp" (> 1 BTC), which are actively buying out the current price drop. For the first time in the past two months, wallets with balances up to 100,000 BTC have joined them. It is also reported that the ETH network has set a staking record for the main altcoin in the region of 15.39 million ETH.

ETH/USD Analysis

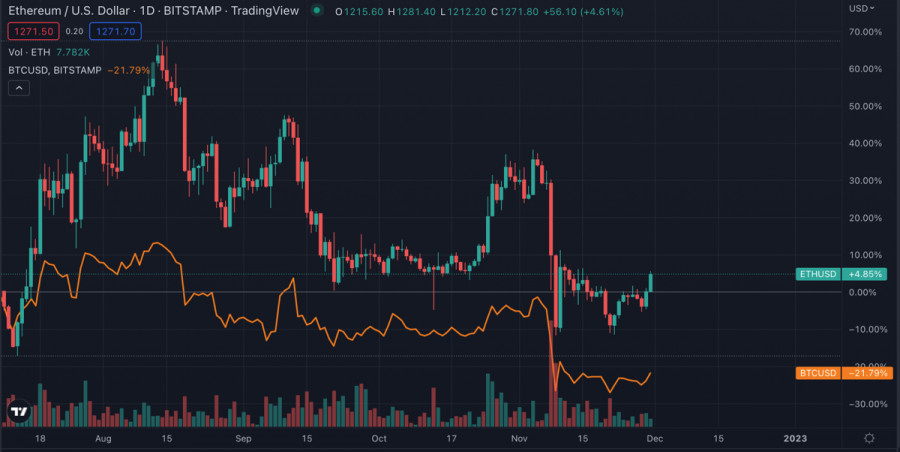
Ethereum, like the entire market, is heavily dependent on Bitcoin at the current stage, and therefore the movement patterns are almost identical. During the current trading week, the market cooled down and moved to the phase of active accumulation. This allowed the market to move to the stage of recovery movement.

This image is no longer relevant

Ethereum has become one of the coins that has benefited the most from the current recovery movement. The asset has risen in price by 9.5% over the past seven days, and the daily gain was 5.5%. The upward movement is also accompanied by an increase in on-chain metrics activity.

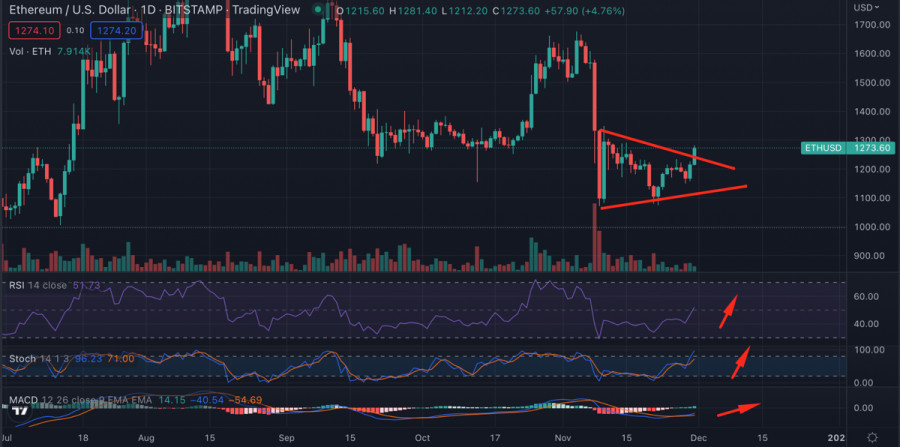
Ethereum has come close to the upper border of the "triangle," within which the altcoin has been trading since the beginning of November . The cryptocurrency formed the second confident green candle in a row and consolidated above $1,250.

This image is no longer relevant

Technical indicators on the daily chart indicate that the altcoin's upward trend continues. The RSI index continues to rise, which indicates the superiority of buyers and the development of bullish momentum.

The Stochastic Oscillator and MACD have formed a bullish crossover and are moving in an upward direction. The identical movement of the two indicators indicates the formation of a short-term upward trend with gradually increasing trading volumes.

ETH/USD on-chain analysis

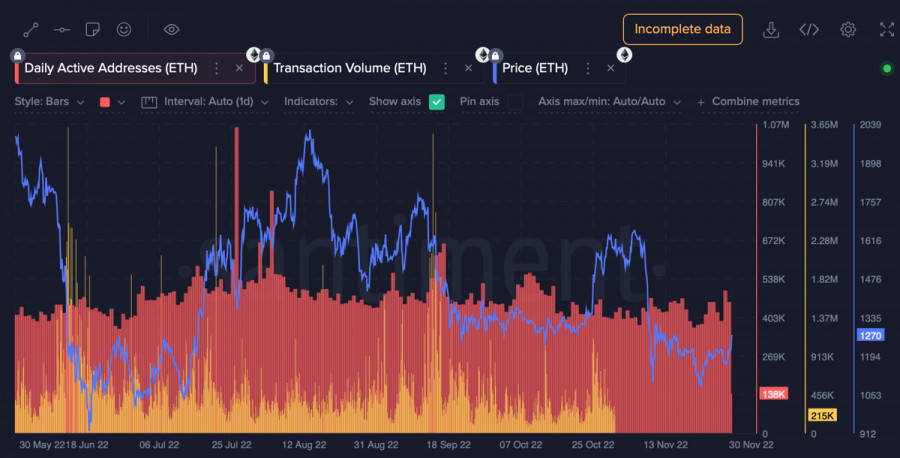
Ethereum on-chain metrics do not show such an iron bullish trend as technical indicators. The formation of upward dynamics is observed only in the indicator of the number of unique addresses in the ETH network. For further growth of ETH/USD quotes, the volume of daily trading should also increase beyond this indicator.

This image is no longer relevant

There is an active accumulation of cryptocurrency by large investors with wallets up to 100,000 ETH. At the same time, "shrimps" and "sharks" continue to sell their stocks or remain neutral. As of writing, on-chain activity does not confirm the strength of technical metrics, which may prevent the final assault on the upper border of the $1,080–$1,300 channel.

Results

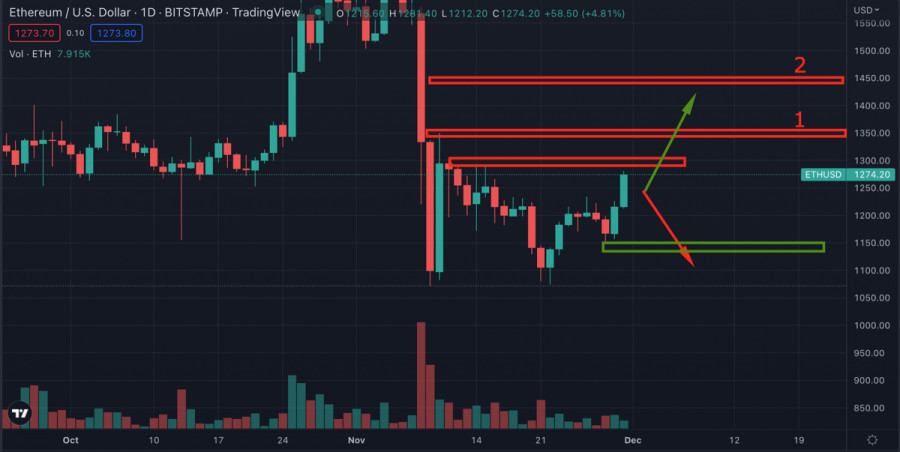
Ethereum follows Bitcoin and actively develops a recovery movement. To begin the implementation of a short-term bullish movement, the altcoin needs to gain a foothold above $1,300. As of writing, ETH hit $1,270 and faced bearish resistance.

This image is no longer relevant

The asset retains chances to continue its bullish movement, and in case of consolidation above $1,300, ETH may reach the level of $1,350–$1,450. However, in case the storm of the $1,300 level is unsuccessful and the price falls below the level of $1,150, the bullish idea is cancelled.

Artem Petrenko,
Analytical expert of InstaForex
© 2007-2025
Select timeframe
5
min
15
min
30
min
1
hour
4
hours
1
day
1
week
Earn on cryptocurrency rate changes with InstaForex
Download MetaTrader 4 and open your first trade
  • Grand Choice
    Contest by
    InstaForex
    InstaForex always strives to help you
    fulfill your biggest dreams.
    JOIN CONTEST

Recommended Stories

Technical Analysis of Intraday Price Movement of Doge Cryptocurrency, Friday May 23, 2025.

It appears that the price movement of the Doge Cryptocurrency on the 4-hour chart is moving above the WMA (21) which has a slope that is going upwards

Arief Makmur 09:04 2025-05-23 UTC+2

Technical Analysis of Intraday Price Movement of Ripple Cryptocurrency, Friday May 23, 2025.

If we look at the 4-hour chart of the Ripple cryptocurrency, it appears to be moving above the WMA (21) which has a steep slope and has successfully broken

Arief Makmur 09:04 2025-05-23 UTC+2

Bitcoin Forecast for May 23, 2025

On Thursday, Bitcoin's price reached the target level of 111,770. The Marlin oscillator appears to be lagging behind the price, giving the impression of a potential divergence — though unconventional

Laurie Bailey 04:45 2025-05-23 UTC+2

Bitcoin aims to hit $120,000? What lies behind its rally and when to expect retracement

On May 22, Bitcoin confidently broke through the $111,888 level, setting a new all-time high of $111,867. Unlike previous rallies marked by retail investor euphoria, this time the market's behavior

Ekaterina Kiseleva 16:12 2025-05-22 UTC+2

Bitcoin extending confident rally

Bitcoin demand appears to be surging, judging by its recent performance. At the time of publication, the BTC/USD pair was trading near 111,200.00, slightly down from today's and the all-time

Jurij Tolin 16:02 2025-05-22 UTC+2

Bitcoin: $115,000 — Next Stop or Bull Trap?

Bitcoin is steadily approaching its all-time high and, according to several analysts, is poised to set a new record. Current levels near $105,000 are more than just numbers — they

Ekaterina Kiseleva 00:58 2025-05-21 UTC+2

BTC/USD Analysis on May 20, 2025

The wave pattern on the 4-hour chart for BTC/USD has been becoming more complex in recent months. We observed a corrective downward structure, which completed its formation around the 75,000

Chin Zhao 11:11 2025-05-20 UTC+2

Technical Analysis of Daily Price Movement of Ethereum Cryptocurrency, Friday May 16, 2025.

If we look at the 4-hour chart, the Ethereum cryptocurrency appears to be moving above the WMA (21) which is a dynamic support where the WMA has a slope that

Arief Makmur 06:09 2025-05-16 UTC+2

Technical Analysis of Intraday Price Movement of Uniswap Cryptocurrency, Friday May 16, 2025.

On the 4-hour chart, the Uniswap cryptocurrency appears to have a Descending Broadening Wedge pattern, so even though the Uniswap price movement is moving below the WMA (21) which

Arief Makmur 06:09 2025-05-16 UTC+2

Bitcoin spikes from $96 600 to $104 500 in 24 hours

Bitcoin has surged to $104,500, after trading at $96,600 just yesterday morning. This confident move above the $100,000 mark clearly signals a return of strong bullish momentum in the cryptocurrency

Jakub Novak 14:49 2025-05-09 UTC+2
Can't speak right now?
Ask your question in the chat.
Widget callback
 

Dear visitor,

Your IP address shows that you are currently located in the USA. If you are a resident of the United States, you are prohibited from using the services of InstaFintech Group including online trading, online transfers, deposit/withdrawal of funds, etc.

If you think you are seeing this message by mistake and your location is not the US, kindly proceed to the website. Otherwise, you must leave the website in order to comply with government restrictions.

Why does your IP address show your location as the USA?

  • - you are using a VPN provided by a hosting company based in the United States;
  • - your IP does not have proper WHOIS records;
  • - an error occurred in the WHOIS geolocation database.

Please confirm whether you are a US resident or not by clicking the relevant button below. If you choose the wrong option, being a US resident, you will not be able to open an account with InstaForex anyway.

We are sorry for any inconvenience caused by this message.