Analysis of GBP/USD, 5-minute chart
On Thursday, the pound/dollar pair showed mixed trading. Since the day was not rich in macroeconomic reports and the news flow was quite calm, the pair simply followed its counterpart, the euro/dollar pair. Such a dynamic led to several signals, which turned out to be false. The pair continues to move sideways on almost all time frames. That is why it is difficult to trade in any period at the moment. This week, there have already been several events that might have led to the trend recovery. However, this did not happen. Traders are a bit anxious as they do not understand in what direction the market may move. They should take into account all the factors as now trading may pose considerable risks.
On Thursday, trading signals were formed near the critical line. Curiously, the price ignored this line, which is expectable amid the flat movement. Traders might use just the first sell signal, but it also was false. All other signals were formed at the beginning of the US trade when the ECB was announcing its meeting results. At that moment, the volatility surged, thus preventing traders from entering the market. That was not a very good trading day. Notably, flat movement rarely leads to profit. It is possible to earn only in case of a clear trend.
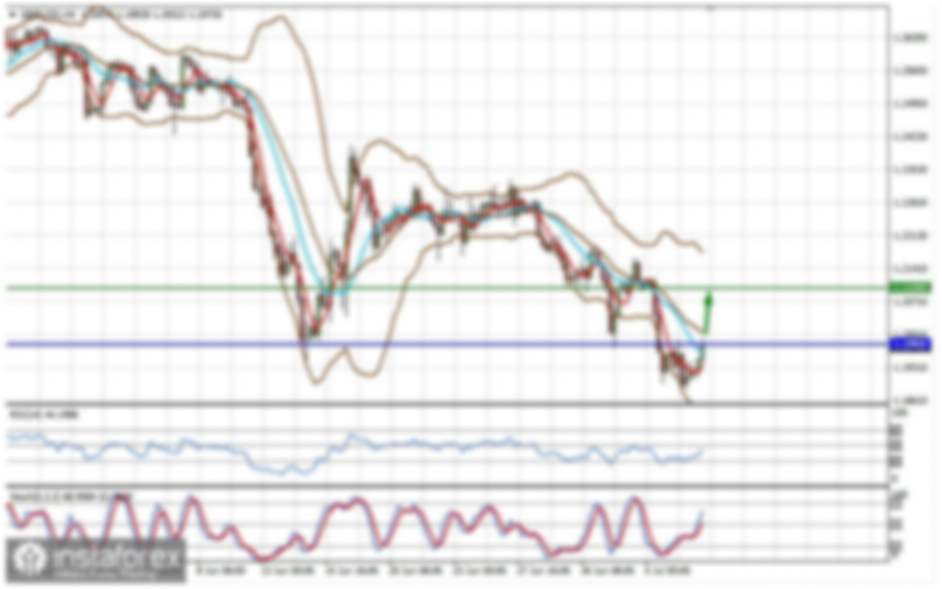
COT report
COT reports for the British pound have not been released for about a month and the latest available report was issued on February 21. Naturally, such reports are of zero importance now but we still may take a look at them. During the last reporting week, the non-commercial group opened 3.3 thousand buy contracts and 4.9 thousand sell contracts. Thus, the net position of non-commercial traders decreased by 1.6 thousand. The net position indicator has been steadily growing over the past months but the mood of major traders still remains bearish. Although the pound sterling is growing against the dollar (in the medium term), it is very difficult to answer the question why it is doing this from a fundamental point of view. It is quite possible that the pound sterling may slump in the near future. Formally, it has already begun its downward movement but so far it looks more like a flat. Notably, both major pairs are moving similarly at the moment. However, the net position for the euro is positive and even implies the imminent completion of the upward momentum, whereas for the pound it is negative. The non-commercial group opened a total of 67 thousand sell orders and 46 thousand buy orders. We remain skeptical about the long-term growth in the British currency and expect it to fall deeper.
Analysis of GBP/USD, one-hour chart
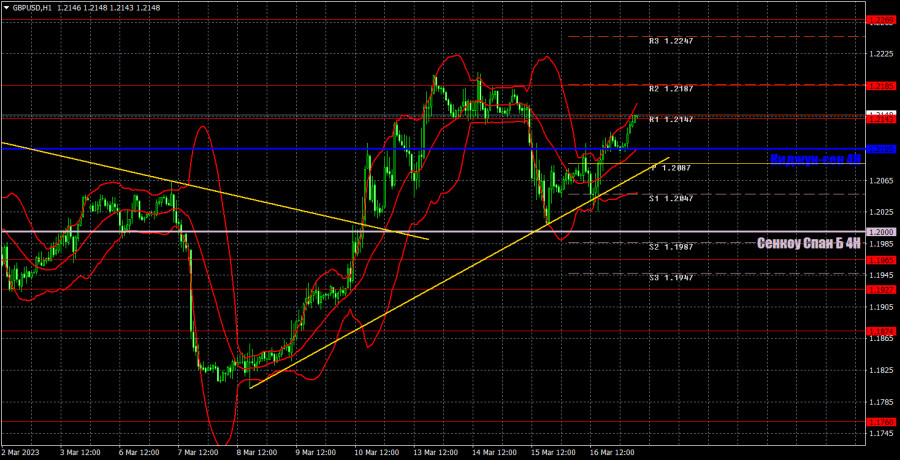
On the one-hour chart, the pound/dollar pair has not dropped below the Ichimoku line yet. That is why it may resume rising at least within the 600-pip channel on the daily chart. In other words, the pound sterling may show only a technical rise. From the fundamental point of view, it should have dropped long ago but now there is a trend line that is slightly supporting the currency. Notably, all the trend lines seen in recent months were short-lived, which is about a week long. Thus, the price may settle below it at any time. On March 17, we highlight the following important levels: 1.1760, 1.1874, 1.1927, 1.1965, 1.2143, 1.2185, 1.2269, 1.2342, 1.2429. The Senkou Span B (1.2000) and Kijun-sen (1.2105) lines can also be signal sources. There are also support and resistance levels, but trading signals are not formed near them. Breakouts and rebounds from these levels could be used as signals. Do not forget to place a stop-loss order at breakeven if the price goes in the right direction by 20 pips. The lines of the Ichimoku indicator can move during the day, which should be taken into account when determining trading signals. On Friday, no important events and publications are expected in the UK. In the US, only the industrial production and consumer sentiment index from the University of Michigan will be released. Traders will react to the data only if the final figures differ significantly from the expected ones.
What we see on the trading charts:
Price levels of support and resistance are thick red lines, near which the movement may end. They do not provide trading signals.
The Kijun-sen and Senkou Span B lines are the lines of the Ichimoku indicator, moved to the one-hour chart from the 4-hour one. They are strong lines.
Extreme levels are thin red lines from which the price bounced earlier. They provide trading signals.
Yellow lines are trend lines, trend channels, and any other technical patterns.
Indicator 1 on the COT charts reflects the net position size of each category of traders.
Indicator 2 on the COT charts reflects the net position size for the non-commercial group.