Yesterday, there were several excellent entry points. Now, let's look at the 5-minute chart and figure out what actually happened. In my morning article, I turned your attention to 1.2330 and recommended making decisions with this level in focus. An upward movement and a false breakout of this level gave a sell signal in the morning. It led to a drop in the pound sterling by more than 50 pips. In the afternoon, after the rate decision of the Bank of England, the GBP/USD pair advanced again. After that, another false breakout of 1.2330 occurred. It created new entry points into short positions with a downward movement of 50 pips. Long positions at 1.2279 triggered a climb by about 30 pips.
When to open long positions on GBP/USD:
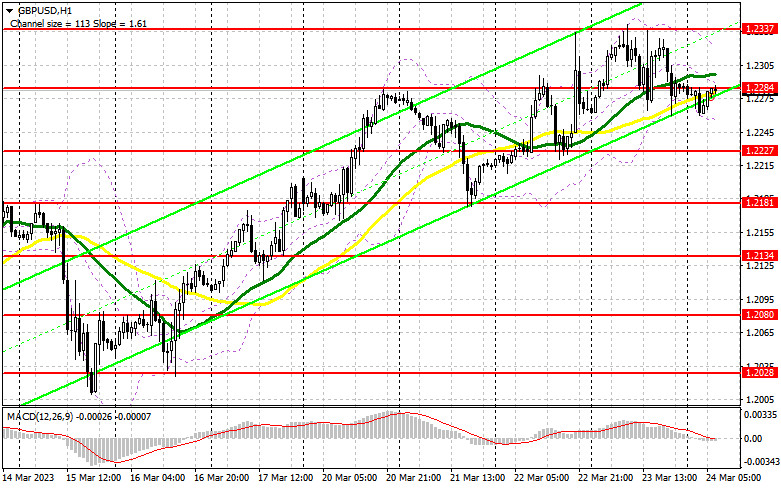
Yesterday, the Bank of England raised the key rate which was in line with market expectations. Hence, the pound sterling failed to grow. As bulls are unwilling to enter the market, the correction has started. In the morning, data on UK retail sales and the Manufacturing and Services PMI Indices are on tap. If the figures are negative, it will escalate pressure on GBP/USD. It may drop to the support level of 1.2227. Only a false breakout of this level will create entry points into long positions with the prospect of a jump to the resistance level of 1.2284. The moving averages are passing at this level. After consolidation and a downward retest of 1.2284, GBP/USD may rise sharply to a new monthly high of 1.2337. At this level, the bulls will again face serious problems. A breakout of this level could trigger an upward movement to 1.2388 where I recommend locking in profits. If the bulls fail to push the pair to 1.2227, the pressure on the pound sterling will return. In this case, I would advise you not to rush into purchases and open long positions near the next support of 1.2181 and only after a false breakout. You could buy GBP/USD at a bounce from a high of 1.2134, keeping in mind an upward intraday correction of 30-35 pips.
When to open short positions on GBP/USD:
Sellers have a chance for further correction. They need to keep the pair below 1.2284 as long as possible today in the morning. A false breakout of this level will give an excellent sell signal against the trend. GBP/USD is likely to decline to the support level of 1.2227 where buyers may enter the market. A breakout and an upward retest of 1.2227 will increase the pressure on the pound sterling. It will generate entry points into short positions. The pair could drop to 1.2181. A more distant target is located at a low of 1.2134. However, a decrease to this level may occur only amid downbeat data, which is unlikely. At this level, I recommend locking in profits. If GBP/USD rises and bears show no energy at 1.2284, bulls are likely to take the upper hand. The pound sterling will jump to a new monthly high of 1.2337. Only a false breakout of this level will give an entry point into short positions. If there is no downward movement there, you could sell GBP/USD at a bounce from 1.2388, keeping in mind a downward intraday correction of 30-35 pips.
COT report
The COT report for March 7 logged a rise in both long and short positions. However, this data is not relevant as the CFTC is still recovering after a cyber-attack. All that's left is to wait for fresh reports. This week, the Fed and the Bank of England will hold monetary policy meetings and make a decision on interest rates. The BoE is expected to stick to a hawkish stance due to persistent inflation. If the Fed gets dovish and the BoE does not, we will see GBP/USD reaching a new monthly high. According to the latest COT report, long non-commercial positions increased by 1,227 to 66,513. Short non-commercial positions rose by 7,549 to 49,111. The non-commercial net position came in at -17,141 versus -21,416. The weekly closing price fell to 1.1830 from 1.2112.
Indicators' signals:
Trading is carried out near the 30 and 50 daily moving averages, which indicates the possibility of a correction.
Moving averages
Note: The period and prices of moving averages are considered by the author on the H1 (1-hour) chart and differ from the general definition of the classic daily moving averages on the daily D1 chart.
Bollinger Bands
If GBP/USD declines, the indicator's lower border at 1.2250 will serve as support.
Description of indicators
- Moving average (moving average, determines the current trend by smoothing out volatility and noise). Period 50. It is marked yellow on the chart.
- Moving average (moving average, determines the current trend by smoothing out volatility and noise). Period 30. It is marked green on the chart.
- MACD indicator (Moving Average Convergence/Divergence - convergence/divergence of moving averages) Quick EMA period 12. Slow EMA period to 26. SMA period 9
- Bollinger Bands (Bollinger Bands). Period 20
- Non-commercial speculative traders, such as individual traders, hedge funds, and large institutions that use the futures market for speculative purposes and meet certain requirements.
- Long non-commercial positions represent the total long open position of non-commercial traders.
- Short non-commercial positions represent the total short open position of non-commercial traders.
- Total non-commercial net position is the difference between the short and long positions of non-commercial traders.