empty
30.03.2023 04:21 AM
How to trade EUR/USD on March 30. Simple trading tips and analysis for beginners

Analyzing Wednesday's trades:

EUR/USD on 30M chart

This image is no longer relevant

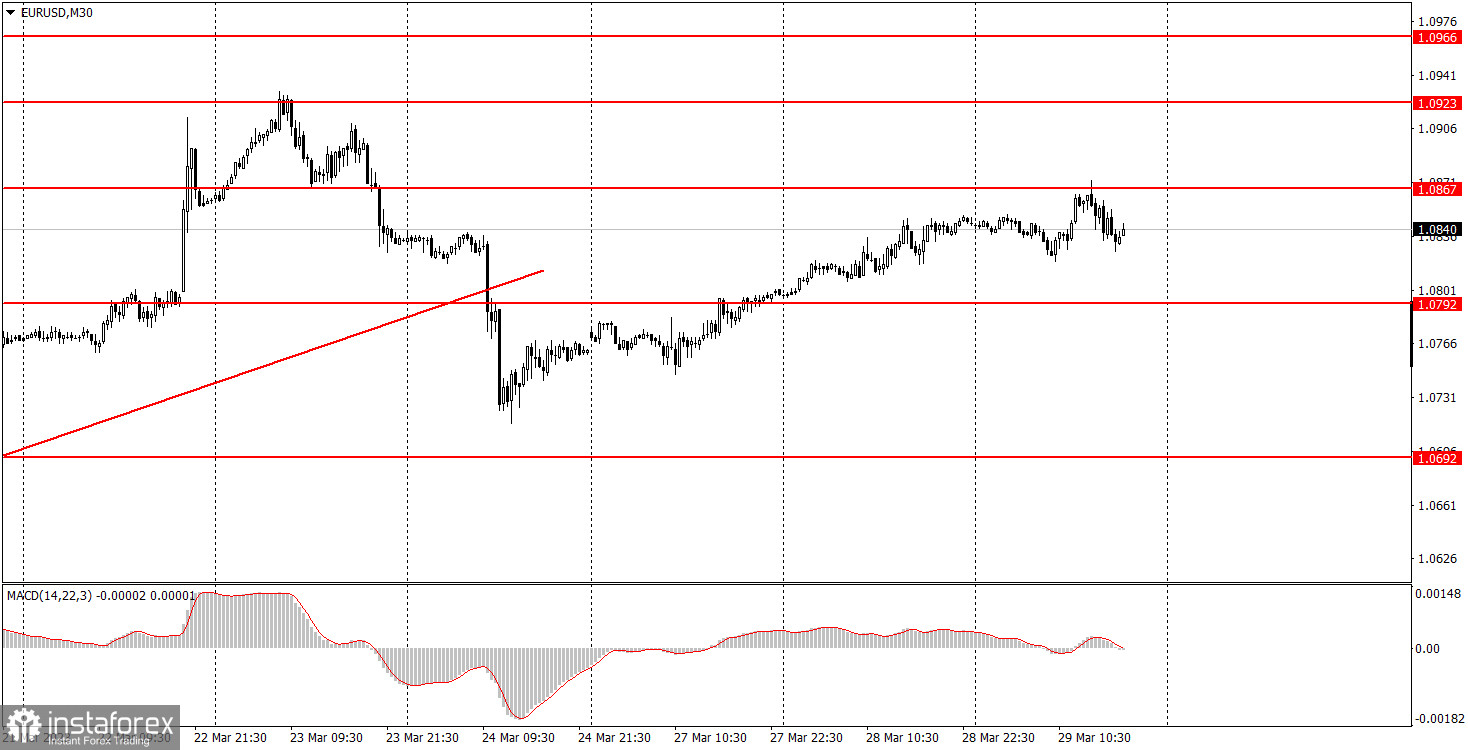
On Wednesday, EUR/USD gradually edged up. Volatility was extremely low again, just 50 pips, like the last two days. It is very difficult to trade the pair with such volatility and the absence of an intraday trend. There was no macroeconomic background or fundamental background on Wednesday. In general, beginners shouldn't have entered the market. The most remarkable thing is that the pair settled below the ascending trend line, but then the pair eventually rose for the next 3.5 days. Slowly but surely. Thus, the current technical picture is so confusing and ambiguous that there is nothing more to add. So it's not the best time to trade.

EUR/USD on 5M chart

This image is no longer relevant

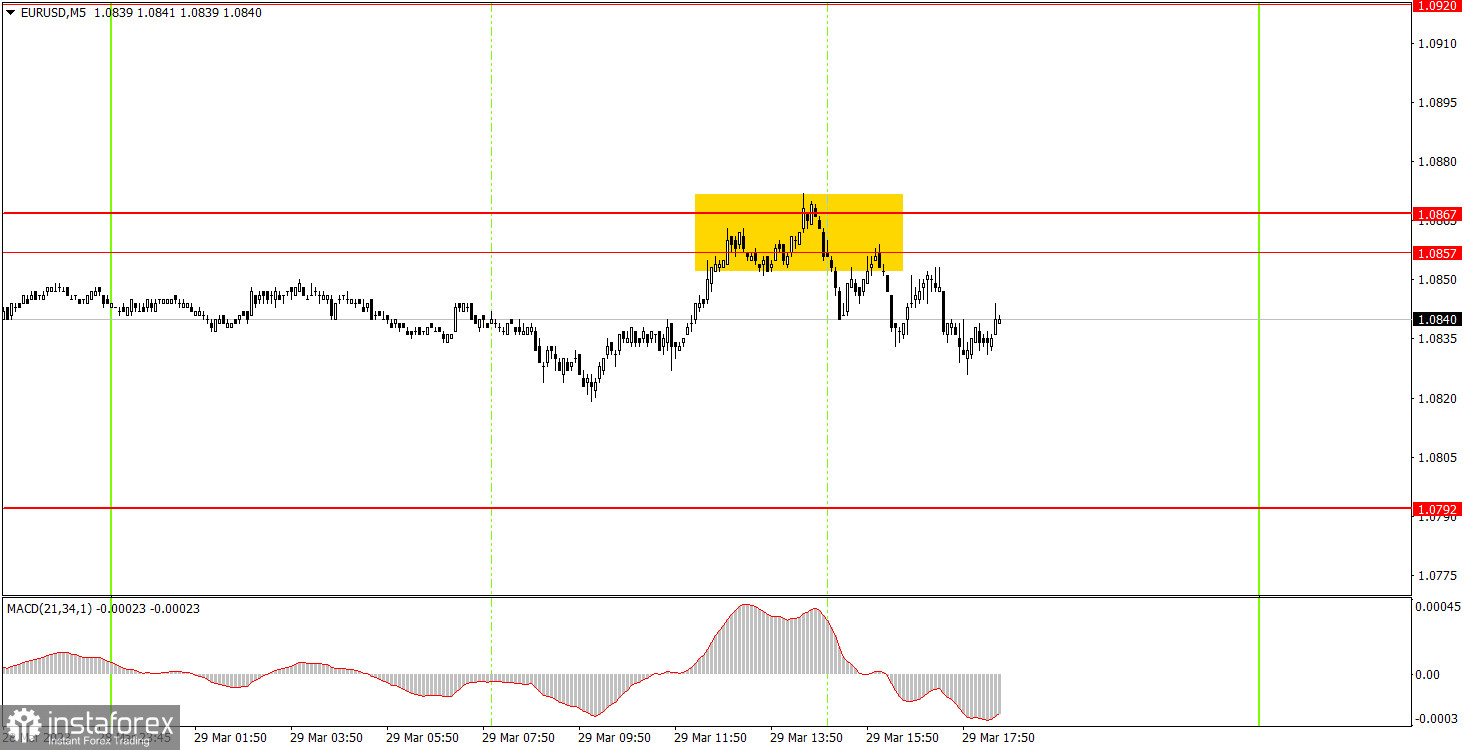
There was only one signal on the 5-minute chart, and that was to sell. More precisely, there were two signals, but they simply duplicated each other. In both cases, the pair rebounded from the area of 1.0857-1.0867 and even managed to go down about 10 pips, so beginners could earn profit. Also, the pair managed to go down by 15 pips, which made it possible for traders to place the Stop Loss on breakeven. Therefore, if someone did not have time to close the position, there wouldn't be any losses. Take note: when the pair passes by as many as 50 points during the day, it is very difficult to expect strong trade signals and profit. But in this case, we can say that we are very lucky that there was only one signal, instead of 5 or 10 false signals.

Trading tips on Thursday:

On the 30-minute chart, the pair has formally finished forming an uptrend and now it might go down, which is what I've been expecting. The euro has exhausted its growth potential, and even rose more than it was justified by the fundamental and macroeconomic background in recent weeks. There are some reasons why the euro grew, but so far we have a sell signal and a need to correct. However, the market completely ignores all the signals and reasons and just continues to buy. On the 5-minute chart, it is recommended to trade at the levels 1.0465-1.0483, 1.0535, 1.0587-1.0607, 1.0692, 1.0737, 1.0792, 1.0857-1.0867, 1.0920-1.0933, 1.0966, 1.0989. As soon as the price passes 15 pips in the right direction, you should set a Stop Loss to breakeven. On Thursday, Germany will release its March inflation report and the U.S. will release its fourth-quarter GDP report in its third estimate. Not the most important data, but when there is no data, the market may react quite violently to these as well.

Basic rules of the trading system:

1) The strength of the signal is determined by the time it took the signal to form (a rebound or a breakout of the level). The quicker it is formed, the stronger the signal is.

2) If two or more positions were opened near a certain level based on a false signal (which did not trigger a Take Profit or test the nearest target level), then all subsequent signals at this level should be ignored.

3) When trading flat, a pair can form multiple false signals or not form them at all. In any case, it is better to stop trading at the first sign of a flat movement.

4) Trades should be opened in the period between the start of the European session and the middle of the US trading hours when all positions must be closed manually.

5) You can trade using signals from the MACD indicator on the 30-minute time frame only amid strong volatility and a clear trend that should be confirmed by a trendline or a trend channel.

6) If two levels are located too close to each other (from 5 to 15 pips), they should be considered support and resistance levels.

On the chart:

Support and Resistance levels are the levels that serve as targets when buying or selling the pair. You can place Take Profit near these levels.

Red lines are channels or trend lines that display the current trend and show in which direction it is better to trade now.

The MACD indicator (14, 22, and 3) consists of a histogram and a signal line. When they cross, this is a signal to enter the market. It is recommended to use this indicator in combination with trend patterns (channels and trendlines).

Important announcements and economic reports that can be found on the economic calendar can seriously influence the trajectory of a currency pair. Therefore, at the time of their release, we recommend trading as carefully as possible or exiting the market in order to avoid sharp price fluctuations.

Beginners on Forex should remember that not every single trade has to be profitable. The development of a clear strategy and money management is the key to success in trading over a long period of time.

Paolo Greco,
Analytical expert of InstaForex
© 2007-2025
Select timeframe
5
min
15
min
30
min
1
hour
4
hours
1
day
1
week
Earn on cryptocurrency rate changes with InstaForex
Download MetaTrader 4 and open your first trade
  • Grand Choice
    Contest by
    InstaForex
    InstaForex always strives to help you
    fulfill your biggest dreams.
    JOIN CONTEST

Recommended Stories

GBP/USD: Trading Plan for the U.S. Session on May 27th (Review of Morning Trades)

In my morning forecast, I highlighted the 1.3545 level and planned to make trading decisions based on it. Let's look at the 5-minute chart and see what happened. A decline

Miroslaw Bawulski 20:13 2025-05-27 UTC+2

EUR/USD: Trading Plan for the U.S. Session on May 27th (Review of the Morning Trades)

In my morning forecast, I highlighted the 1.1374 level and planned to make trading decisions based on it. Let's look at the 5-minute chart to analyze what happened. A decline

Miroslaw Bawulski 20:07 2025-05-27 UTC+2

How to Trade the GBP/USD Pair on May 27? Simple Tips and Trade Analysis for Beginners

Analysis of Monday's Trades 1H Chart of GBP/USD On Monday, the GBP/USD pair reached 1.3580 — heights the British pound hadn't seen in over three years. As we've said

Paolo Greco 07:04 2025-05-27 UTC+2

How to Trade the EUR/USD Pair on May 27? Simple Tips and Trade Analysis for Beginners

Analysis of Monday's Trades 1H Chart of EUR/USD The EUR/USD currency pair continued its upward movement on Monday, which had started back on Friday. Only in the second half

Paolo Greco 07:04 2025-05-27 UTC+2

Trading Recommendations and Analysis for GBP/USD on May 27: No Reason to Be Upset

The GBP/USD currency pair also traded higher on Monday, although it pulled back slightly during the day. This retreat followed the announcement that the increase in tariffs for the European

Paolo Greco 05:26 2025-05-27 UTC+2

Trading Recommendations and Analysis for EUR/USD on May 27: The Market Is Starting to Get Angry

On Monday, the EUR/USD currency pair initially rose following Trump's announcement that tariffs on EU goods would increase to 50% starting June 1. However, the pair subsequently fell after Trump

Paolo Greco 05:26 2025-05-27 UTC+2

GBP/USD: Trading Plan for the U.S. Session on May 26th (Review of Morning Trades)

In my morning forecast, I focused on the 1.3570 level and planned to make entry decisions around it. Let's look at the 5-minute chart and analyze what happened. A decline

Miroslaw Bawulski 15:03 2025-05-26 UTC+2

EUR/USD: Trading Plan for the U.S. Session on May 26th (Review of Morning Trades)

In my morning forecast, I focused on the 1.1416 level as a key area for making trading decisions. Let's look at the 5-minute chart and break down what happened. After

Miroslaw Bawulski 14:59 2025-05-26 UTC+2

How to Trade the GBP/USD Pair on May 26? Simple Tips and Trade Analysis for Beginners

Analysis of Friday's Trades 1H Chart of GBP/USD The GBP/USD pair also showed a confident upward movement on Friday, driven by the overall uptrend observed over the past two weeks

Paolo Greco 07:57 2025-05-26 UTC+2

How to Trade the EUR/USD Pair on May 26? Simple Tips and Trade Analysis for Beginners

Analysis of Friday's Trades 1H Chart of EUR/USD On Friday, the EUR/USD currency pair continued its upward movement after bouncing from the 1.1267 level during a brief correction. The uptrend

Paolo Greco 07:57 2025-05-26 UTC+2
Can't speak right now?
Ask your question in the chat.
Widget callback
 

Dear visitor,

Your IP address shows that you are currently located in the USA. If you are a resident of the United States, you are prohibited from using the services of InstaFintech Group including online trading, online transfers, deposit/withdrawal of funds, etc.

If you think you are seeing this message by mistake and your location is not the US, kindly proceed to the website. Otherwise, you must leave the website in order to comply with government restrictions.

Why does your IP address show your location as the USA?

  • - you are using a VPN provided by a hosting company based in the United States;
  • - your IP does not have proper WHOIS records;
  • - an error occurred in the WHOIS geolocation database.

Please confirm whether you are a US resident or not by clicking the relevant button below. If you choose the wrong option, being a US resident, you will not be able to open an account with InstaForex anyway.

We are sorry for any inconvenience caused by this message.