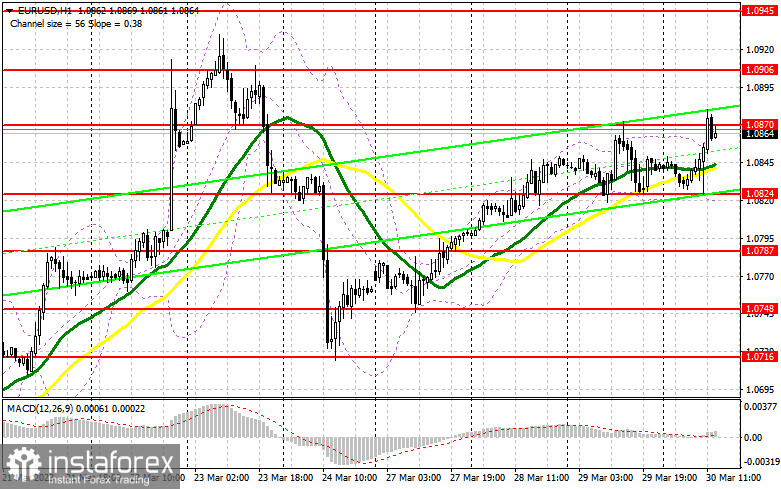
In my morning article, I turned your attention to 1.0824 and recommended making decisions with this level in focus. Now, let's look at the 5-minute chart and figure out what actually happened. A decline and a false breakout of this level led to a buy signal. The euro rose by 40 pips. A false breakout of 1.0879 gave a sell signal. However, traders are in no hurry to lock in profits. For the afternoon, the technical outlook remained the same as well as the trading strategy.
When to open long positions on EUR/USD:
In the afternoon, the US will unveil initial jobless claims data and revised GDP figures for the fourth quarter. However, traders are mainly waiting for the speeches of Fed official Neil Kashkari and Treasury Secretary Janet Yellen. If Janet Yellen talks again about new lending programs to support the banking sector, it will bolster demand for risk assets and weaken the US dollar. EUR/USD is sure to rise higher. It could reach monthly highs. In case of a decline, I would advise you to postpone long positions until a false breakout of 1.0824. You could buy there after a false breakdown by analogy with what I have analyzed above. It is likely to lead to an upward movement to the resistance level of 1.0870. The pair already tested this level in the morning. So, I don't think one should focus on this level. A breakout and a downward retest of this level will give an additional entry point into long positions with an increase to 1.0906. A more distant target will be a monthly high of 1.0945 level where I recommend locking in profits. If EUR/USD drops and bulls show no activity at 1.0824 during the American session, the pressure on the euro will return. A downward movement to 1.0787 may occur. Only a false breakout of this level may provide new entry points into long positions. You could buy EUR/USD at a bounce from 1.0748 or 1.0716, keeping in mind an upward intraday correction of 30-35 pips.
When to open short positions on EUR/USD:
Sellers tried to take control of 1.0870 but failed. They will hardly enter the market until the release of strong US economic reports. If they fail to push the pair below this level, the bulls will be in control. There will be a downward correction at the end of the month. I would advise you to open short positions after a false breakout of 1.0870, which could lead to a decrease to the support level of 1.0824. Bears failed to push the pair below this level in the morning. A breakout and an upward retest of this level may trigger a downward movement to 1.0787. A drop below this level after strong US economic reports may lead to a decline to 1.0748, which will facilitate a bearish bias. I recommend locking in profits at this level. If EUR/USD rises during the American session and bears show no energy at 1.0870, which is likely, it would be wise to postpone short positions until a false breakout of 1.0906. You could sell EUR/USD at a bounce from 1.0945, keeping in mind a downward intraday correction of 30-35 pips.
COT report
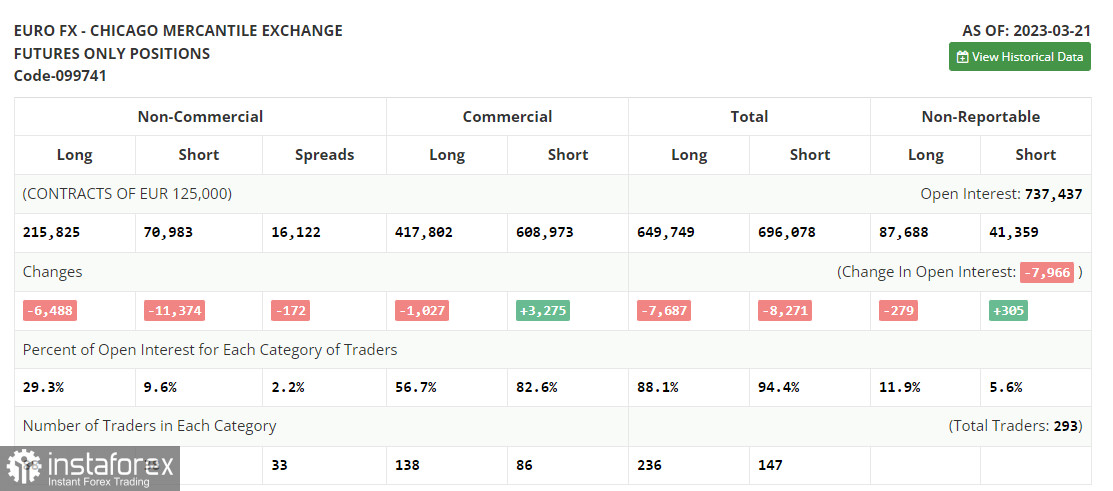
According to the COT report from March 21, the number of both long and short positions dropped. The Fed's meeting held in March affected the market situation. However, the US dollar is unlikely to slump since the regulator remained stuck to its policy. The aggressive approach of the ECB is the only fact that is supporting the euro at the moment. The central bank is planning to raise the key interest rate higher without altering its stance. Thus, the COT report unveiled that the number of long non-commercial positions decreased by 6,488 to 215,825, while the number of short non-commercial positions fell by 11,374 to 70,983. At the end of the week, the total non-commercial net position increased to 144,842 against 139,956. The weekly closing price rose to 1.0821 against 1.0803.
Indicators' signals:
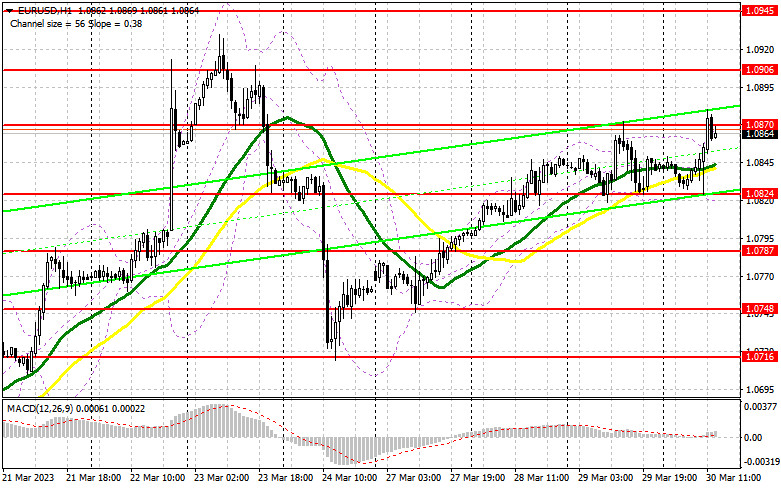
Trading is carried out above the 30 and 50 daily moving averages, which indicates a further increase.
Moving averages
Note: The period and prices of moving averages are considered by the author on the H1 (1-hour) chart and differ from the general definition of the classic daily moving averages on the daily D1 chart.
Bollinger Bands
If EUR/USD moves up, the indicator's upper border at 1.0870 will serve as resistance.
Description of indicators
- Moving average (moving average, determines the current trend by smoothing out volatility and noise). Period 50. It is marked yellow on the chart.
- Moving average (moving average, determines the current trend by smoothing out volatility and noise). Period 30. It is marked green on the chart.
- MACD indicator (Moving Average Convergence/Divergence - convergence/divergence of moving averages) Quick EMA period 12. Slow EMA period to 26. SMA period 9
- Bollinger Bands (Bollinger Bands). Period 20
- Non-commercial speculative traders, such as individual traders, hedge funds, and large institutions that use the futures market for speculative purposes and meet certain requirements.
- Long non-commercial positions represent the total long open position of non-commercial traders.
- Short non-commercial positions represent the total short open position of non-commercial traders.
- Total non-commercial net position is the difference between the short and long positions of non-commercial traders.