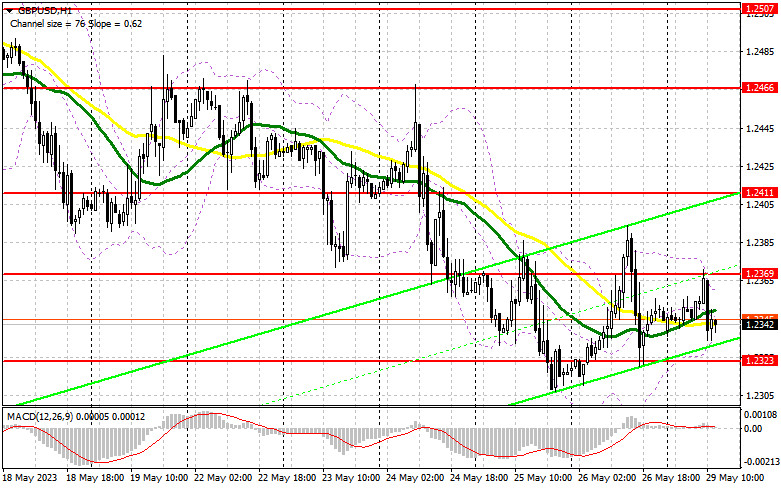
In my morning forecast, I drew attention to the level of 1.2345 and recommended making trading decisions based on it. Let's look at the 5-minute chart and analyze what happened there. Breaking through this area did not allow for an entry point for long positions, but selling pressure didn't materialize either, as trading mainly revolved around 1.2345. The technical picture was completely reassessed in the second half of the day.
To open long positions on GBP/USD, the following is required:
Considering that there were no significant statistics during the American session, I adjusted the nearest support and resistance levels slightly closer. I want to get some decent entry points for long positions, especially against positive news regarding the US debt limit. I will continue to act only on the downside, as going against the bearish market is not the best idea. Only after a false breakout in the area of the new support at 1.2323 can we expect a buy signal, leading to an upward move toward 1.2369. A breakout and a reverse test from top to bottom of this range will form an additional signal to open long positions and strengthen the presence of bulls in the market at the beginning of the week, pushing towards 1.2411. The ultimate target will be the area around 1.2466, where I will take profit.
In the scenario of a decline in the pound towards 1.2323 and a lack of activity from buyers, I will postpone buying until the next monthly low at 1.2276. I will also enter long positions there only on a false breakout. I plan to buy GBP/USD only on a rebound from the minimum at 1.2237, with a 30-35 point correction target within the day.
To open short positions on GBP/USD, the following is required:
Sellers continue to control the situation, so we shouldn't exclude the continuation of the bearish market even against the backdrop of positive news about US debt. The most important thing is to notice the new resistance level at 1.2369, which formed during the first half of the day. Only a false breakout there will restore confidence to sellers and signal a sell-off towards 1.2323. A breakout and a reverse test from the bottom to the top of this range will strengthen the bearish trend, forming a signal to open short positions with a decline towards 1.2276. The ultimate target remains the minimum at 1.2237, where I will take profit.
With a GBP/USD rise and a lack of activity at 1.2369 in the second half of the day, combined with the absence of fundamental statistics, sellers' stop orders will come into play, leading to further upward correction of the pair. In that case, I will postpone selling until testing the resistance at 1.2411. A false breakout there will be an entry point for short positions. If there is no downward movement from 1.2411, I will sell GBP/USD on a rebound from 1.2466, but only expecting a downward correction of 30-35 points within the day.
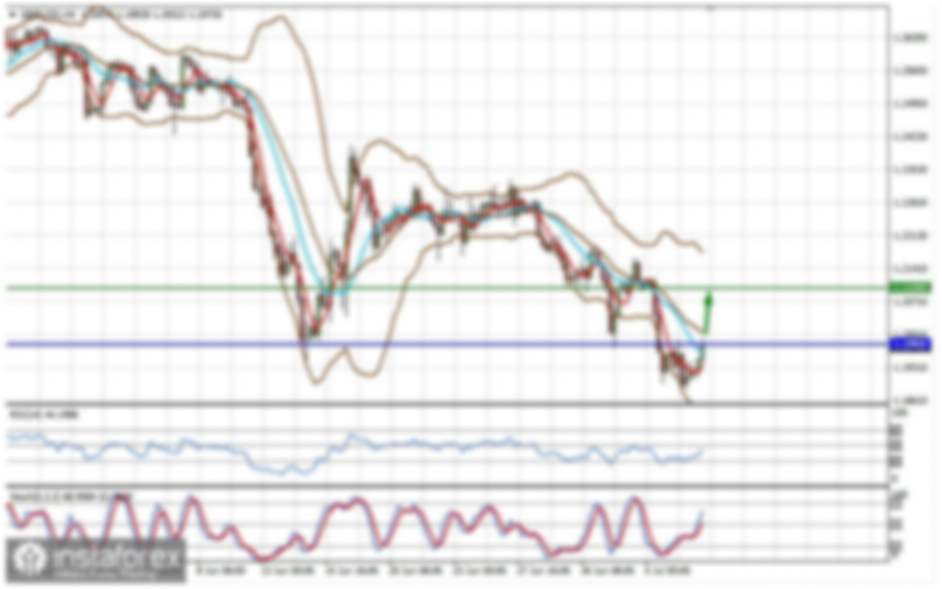
In the latest COT (Commitment of Traders) report as of May 16, there was an increase in long positions and a decrease in short positions. The correction of the British pound was quite significant, and the pair is trading at very attractive prices, which is reflected in the report. Once the US debt limit issue is resolved, the demand for risky assets will return, and the pound will be able to recover quite solidly. Remember that the Federal Reserve plans to pause its cycle of interest rate hikes, which will also put pressure on the US dollar. The latest COT report states that non-commercial short positions decreased by 2,238 to 64,795, while non-commercial long positions increased by 5,827 to 77,388. This led to an increase in the non-commercial net position to 12,593 from 4,528 a week earlier. The weekly price decreased to 1.2495 from 1.2635.
Indicator signals:
Moving averages.
Trading occurs around the 30-day and 50-day moving averages, indicating market uncertainty.
Note: The author considers the period and prices of the moving averages on the H1 hourly chart, which differ from the general definition of classic daily moving averages on the D1 daily chart.
Bollinger Bands
In case of an upward movement, the upper boundary of the indicator around 1.2365 will act as resistance.
Description of indicators:
- Moving average (determines the current trend by smoothing volatility and noise). Period 50. Marked in yellow on the chart.
- Moving average (determines the current trend by smoothing volatility and noise). Period 30. Marked in green on the chart.
- MACD indicator (Moving Average Convergence/Divergence) Fast EMA (period 12). Slow EMA (period 26). SMA (period 9).
- Bollinger Bands. Period 20.
- Non-commercial traders - speculators, such as individual traders, hedge funds, and large institutions, use the futures market for speculative purposes and meet certain requirements.
- Long non-commercial positions represent the total long open positions of non-commercial traders.
- Short non-commercial positions represent the total short open positions of non-commercial traders.
- The net non-commercial position is the difference between non-commercial traders' short and long positions.