


signal strength 1 of 5
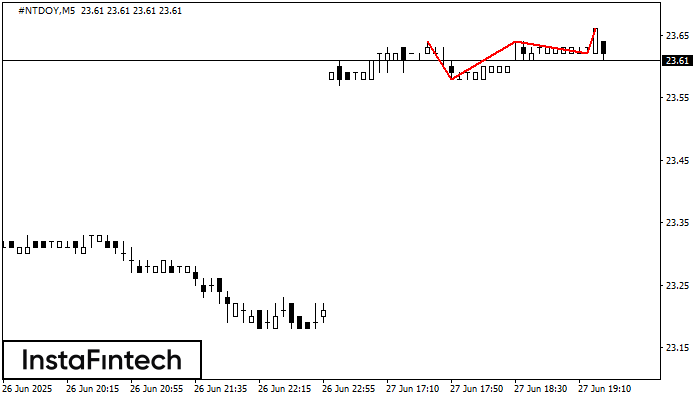
The Triple Top pattern has formed on the chart of the #NTDOY M5. Features of the pattern: borders have an ascending angle; the lower line of the pattern has the coordinates 23.58/23.62 with the upper limit 23.64/23.66; the projection of the width is 6 points. The formation of the Triple Top figure most likely indicates a change in the trend from upward to downward. This means that in the event of a breakdown of the support level of 23.58, the price is most likely to continue the downward movement.
The M5 and M15 time frames may have more false entry points.
See Also
- All
- Double Top
- Flag
- Head and Shoulders
- Pennant
- Rectangle
- Triangle
- Triple top
- All
- #AAPL
- #AMZN
- #Bitcoin
- #EBAY
- #FB
- #GOOG
- #INTC
- #KO
- #MA
- #MCD
- #MSFT
- #NTDOY
- #PEP
- #TSLA
- #TWTR
- AUDCAD
- AUDCHF
- AUDJPY
- AUDUSD
- EURCAD
- EURCHF
- EURGBP
- EURJPY
- EURNZD
- EURRUB
- EURUSD
- GBPAUD
- GBPCHF
- GBPJPY
- GBPUSD
- GOLD
- NZDCAD
- NZDCHF
- NZDJPY
- NZDUSD
- SILVER
- USDCAD
- USDCHF
- USDJPY
- USDRUB
- All
- M5
- M15
- M30
- H1
- D1
- All
- Buy
- Sale
- All
- 1
- 2
- 3
- 4
- 5
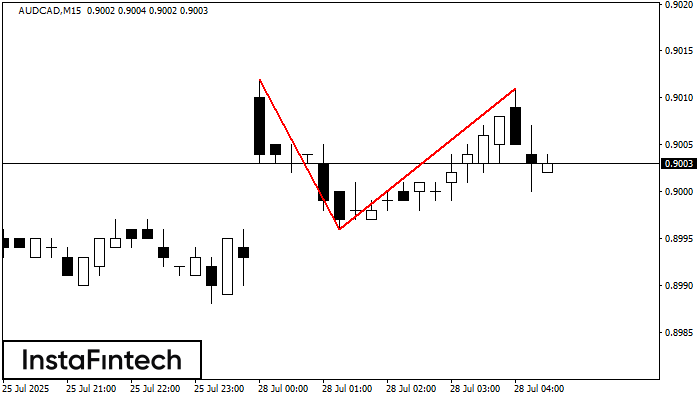
The Double Top pattern has been formed on AUDCAD M15. It signals that the trend has been changed from upwards to downwards. Probably, if the base of the pattern 0.8996
The M5 and M15 time frames may have more false entry points.
Open chart in a new window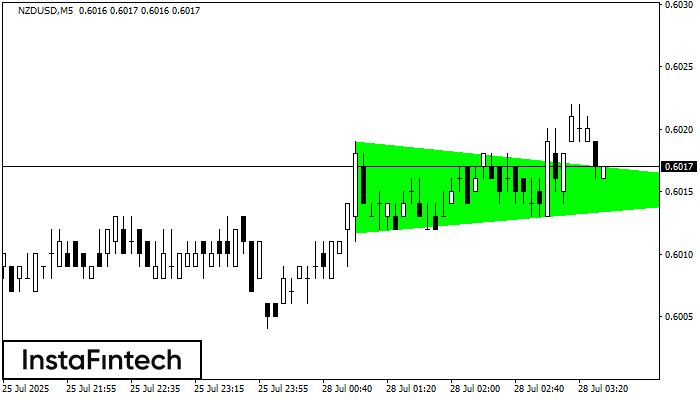
According to the chart of M5, NZDUSD formed the Bullish Symmetrical Triangle pattern. Description: This is the pattern of a trend continuation. 0.6019 and 0.6012 are the coordinates
The M5 and M15 time frames may have more false entry points.
Open chart in a new window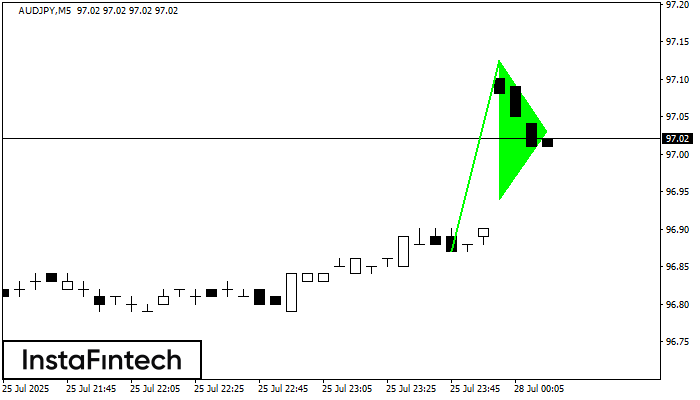
The Bullish pennant signal – Trading instrument AUDJPY M5, continuation pattern. Forecast: it is possible to set up a buy position above the pattern’s high of 97.13, with the prospect
The M5 and M15 time frames may have more false entry points.
Open chart in a new window


