signal strength 1 of 5
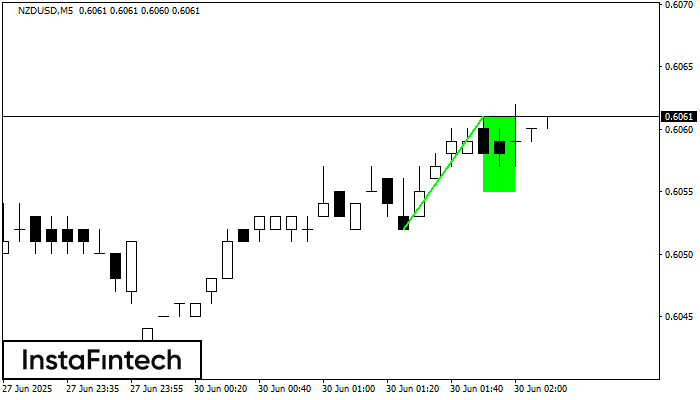
The Bullish Flag pattern has been formed on NZDUSD at M5. The lower boundary of the pattern is located at 0.6055/0.6055, while the higher boundary lies at 0.6061/0.6061. The projection of the flagpole is 9 points. This formation signals that the upward trend is most likely to continue. Therefore, if the level of 0.6061 is broken, the price will move further upwards.
The M5 and M15 time frames may have more false entry points.
See Also
- All
- Double Top
- Flag
- Head and Shoulders
- Pennant
- Rectangle
- Triangle
- Triple top
- All
- #AAPL
- #AMZN
- #Bitcoin
- #EBAY
- #FB
- #GOOG
- #INTC
- #KO
- #MA
- #MCD
- #MSFT
- #NTDOY
- #PEP
- #TSLA
- #TWTR
- AUDCAD
- AUDCHF
- AUDJPY
- AUDUSD
- EURCAD
- EURCHF
- EURGBP
- EURJPY
- EURNZD
- EURRUB
- EURUSD
- GBPAUD
- GBPCHF
- GBPJPY
- GBPUSD
- GOLD
- NZDCAD
- NZDCHF
- NZDJPY
- NZDUSD
- SILVER
- USDCAD
- USDCHF
- USDJPY
- USDRUB
- All
- M5
- M15
- M30
- H1
- D1
- All
- Buy
- Sale
- All
- 1
- 2
- 3
- 4
- 5
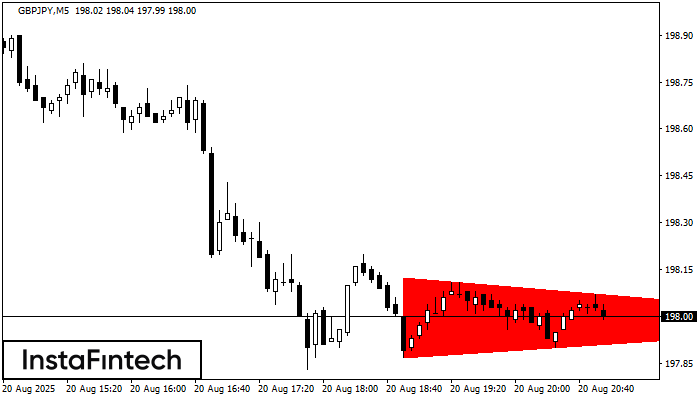
According to the chart of M5, GBPJPY formed the Bearish Symmetrical Triangle pattern. This pattern signals a further downward trend in case the lower border 197.87 is breached. Here
The M5 and M15 time frames may have more false entry points.
Open chart in a new window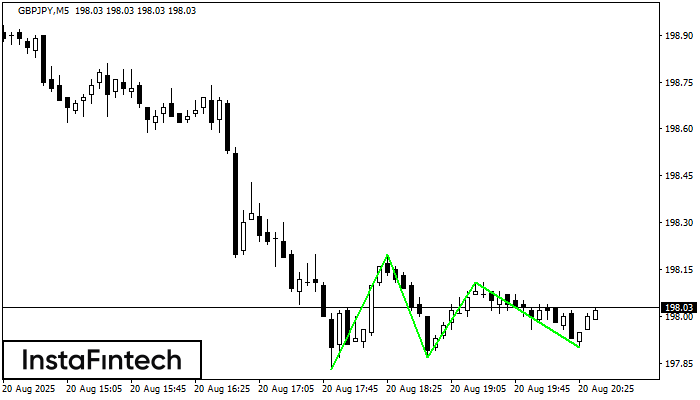
The Triple Bottom pattern has formed on the chart of GBPJPY M5. Features of the pattern: The lower line of the pattern has coordinates 198.20 with the upper limit 198.20/198.11
The M5 and M15 time frames may have more false entry points.
Open chart in a new window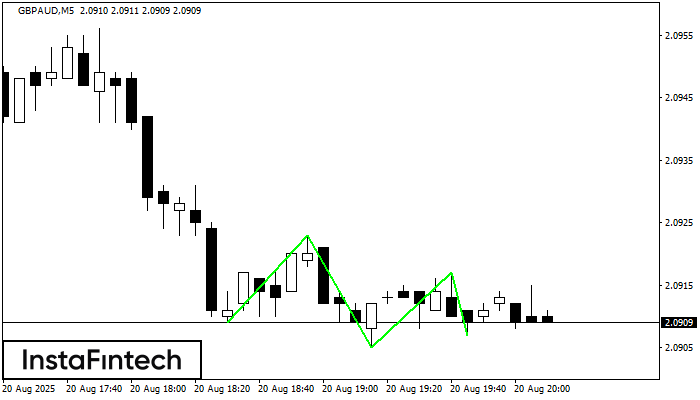
The Triple Bottom pattern has formed on the chart of GBPAUD M5. Features of the pattern: The lower line of the pattern has coordinates 2.0923 with the upper limit 2.0923/2.0917
The M5 and M15 time frames may have more false entry points.
Open chart in a new window