signal strength 3 of 5
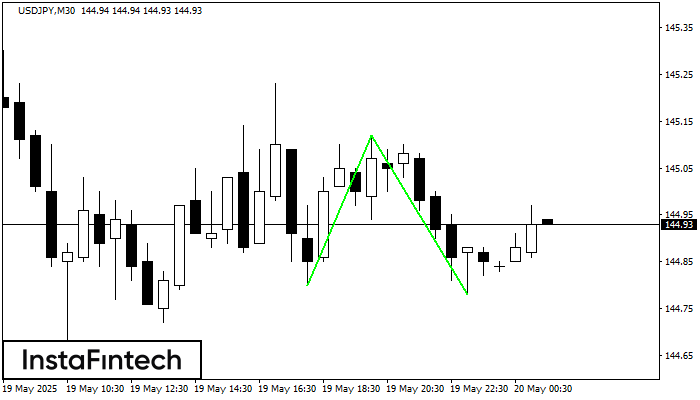
The Double Bottom pattern has been formed on USDJPY M30; the upper boundary is 145.12; the lower boundary is 144.78. The width of the pattern is 32 points. In case of a break of the upper boundary 145.12, a change in the trend can be predicted where the width of the pattern will coincide with the distance to a possible take profit level.
- All
- Double Top
- Flag
- Head and Shoulders
- Pennant
- Rectangle
- Triangle
- Triple top
- All
- #AAPL
- #AMZN
- #Bitcoin
- #EBAY
- #FB
- #GOOG
- #INTC
- #KO
- #MA
- #MCD
- #MSFT
- #NTDOY
- #PEP
- #TSLA
- #TWTR
- AUDCAD
- AUDCHF
- AUDJPY
- AUDUSD
- EURCAD
- EURCHF
- EURGBP
- EURJPY
- EURNZD
- EURRUB
- EURUSD
- GBPAUD
- GBPCHF
- GBPJPY
- GBPUSD
- GOLD
- NZDCAD
- NZDCHF
- NZDJPY
- NZDUSD
- SILVER
- USDCAD
- USDCHF
- USDJPY
- USDRUB
- All
- M5
- M15
- M30
- H1
- D1
- All
- Buy
- Sale
- All
- 1
- 2
- 3
- 4
- 5
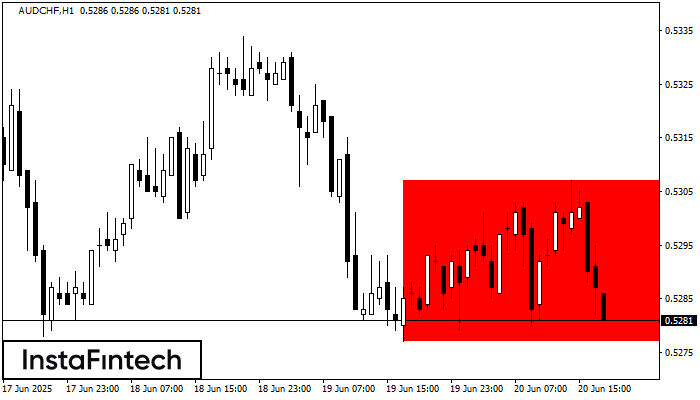
According to the chart of H1, AUDCHF formed the Bearish Rectangle. The pattern indicates a trend continuation. The upper border is 0.5307, the lower border is 0.5277. The signal means
Open chart in a new window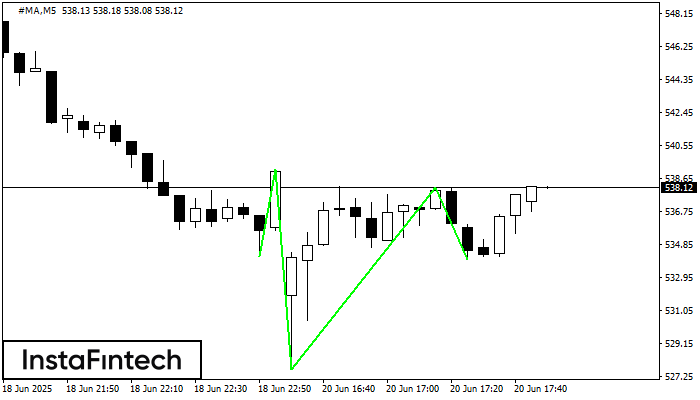
According to the chart of M5, #MA formed the Inverse Head and Shoulder pattern. The Head’s top is set at 538.15 while the median line of the Neck is found
The M5 and M15 time frames may have more false entry points.
Open chart in a new window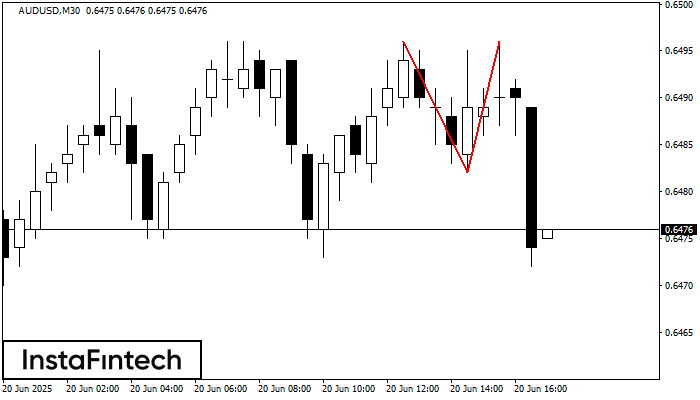
On the chart of AUDUSD M30 the Double Top reversal pattern has been formed. Characteristics: the upper boundary 0.6496; the lower boundary 0.6482; the width of the pattern 14 points
Open chart in a new window