signal strength 2 of 5
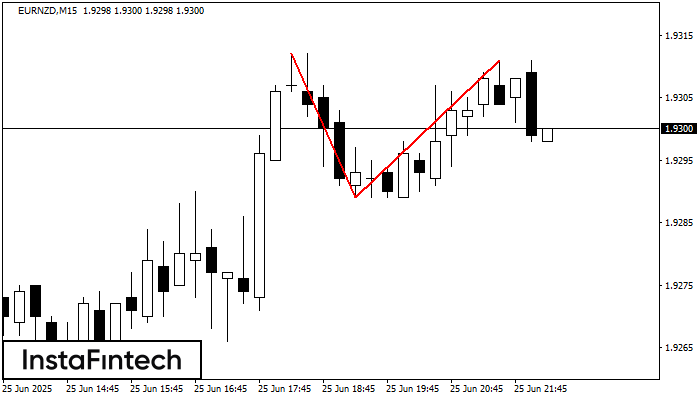
The Double Top pattern has been formed on EURNZD M15. It signals that the trend has been changed from upwards to downwards. Probably, if the base of the pattern 1.9289 is broken, the downward movement will continue.
The M5 and M15 time frames may have more false entry points.
See Also
- All
- Double Top
- Flag
- Head and Shoulders
- Pennant
- Rectangle
- Triangle
- Triple top
- All
- #AAPL
- #AMZN
- #Bitcoin
- #EBAY
- #FB
- #GOOG
- #INTC
- #KO
- #MA
- #MCD
- #MSFT
- #NTDOY
- #PEP
- #TSLA
- #TWTR
- AUDCAD
- AUDCHF
- AUDJPY
- AUDUSD
- EURCAD
- EURCHF
- EURGBP
- EURJPY
- EURNZD
- EURRUB
- EURUSD
- GBPAUD
- GBPCHF
- GBPJPY
- GBPUSD
- GOLD
- NZDCAD
- NZDCHF
- NZDJPY
- NZDUSD
- SILVER
- USDCAD
- USDCHF
- USDJPY
- USDRUB
- All
- M5
- M15
- M30
- H1
- D1
- All
- Buy
- Sale
- All
- 1
- 2
- 3
- 4
- 5
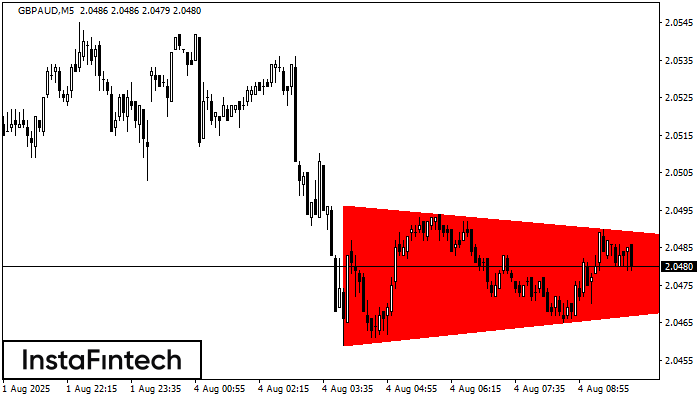
According to the chart of M5, GBPAUD formed the Bearish Symmetrical Triangle pattern. This pattern signals a further downward trend in case the lower border 2.0459 is breached. Here
The M5 and M15 time frames may have more false entry points.
Open chart in a new window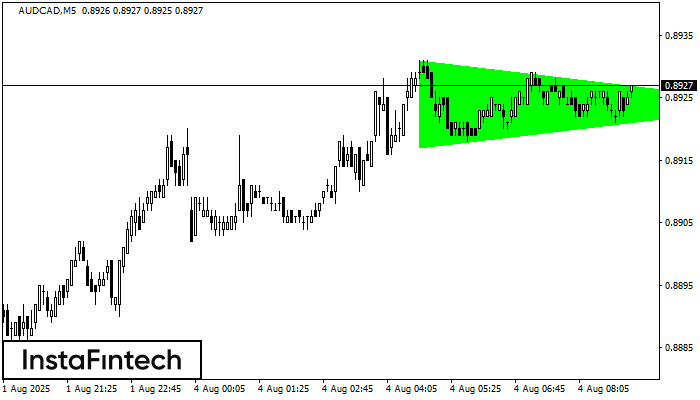
According to the chart of M5, AUDCAD formed the Bullish Symmetrical Triangle pattern. The lower border of the pattern touches the coordinates 0.8917/0.8924 whereas the upper border goes across 0.8931/0.8924
The M5 and M15 time frames may have more false entry points.
Open chart in a new window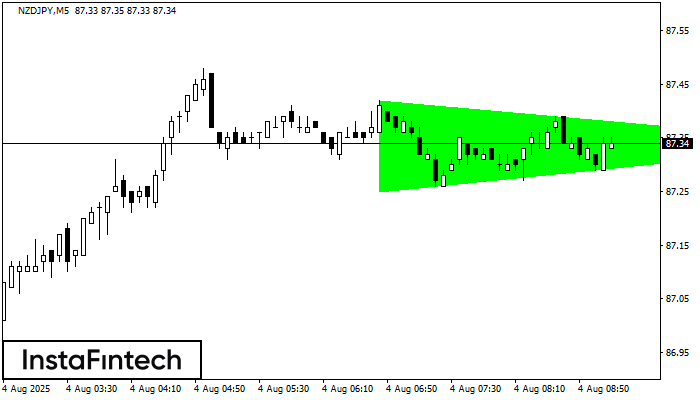
According to the chart of M5, NZDJPY formed the Bullish Symmetrical Triangle pattern. The lower border of the pattern touches the coordinates 87.25/87.34 whereas the upper border goes across 87.42/87.34
The M5 and M15 time frames may have more false entry points.
Open chart in a new window