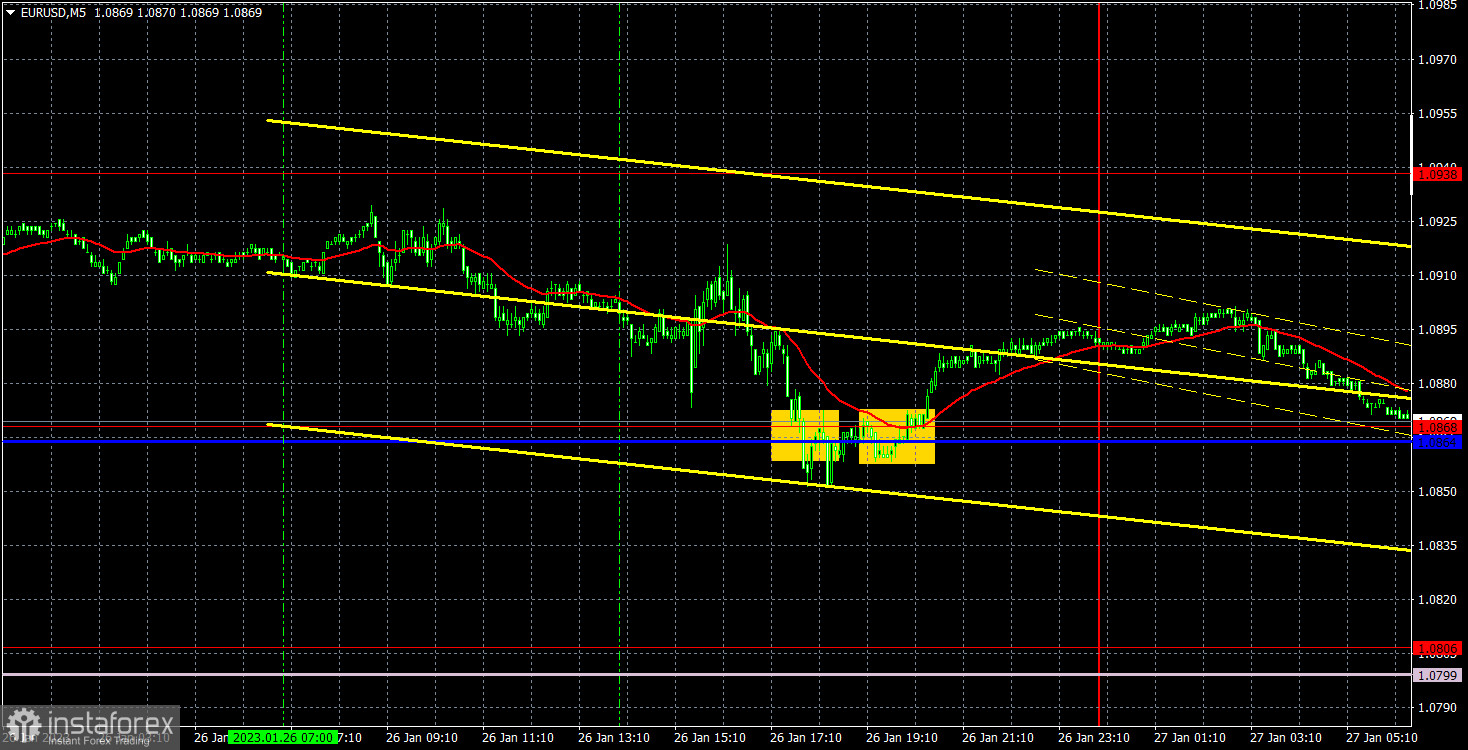
empty
27.01.2023 08:14 AM
Outlook and trading signals for EUR/USD on January 27. COT report. Analysis of market situation. The U.S. GDP report did not help the dollar.

M5 chart of EUR/USD

This image is no longer relevant

EUR/USD did not show any interesting movements on Thursday. The price was still moving slightly above the critical line, and the entire movement still looks more like a flat than a trend. The pair surged at the beginning of this week, which many regarded as resumption of the uptrend. Actually, the price has simply moved into a horizontal channel just above the previous one. Therefore, we are dealing with a non-standard flat. Yesterday, there were some interesting reports in America. As we mentioned in our fundamental articles, all the four reports, which traders may find interesting, were better than forecasts, some of them turned out to be even better. However, the U.S. currency failed to benefit from it. In particular, the GDP report showed the economy growing at 2.9%, not 2.6% as estimated. But the market still refuses to buy the dollar.

Thursday's trading signals were average. There were two signals near the 1.0864-1.0868 area, which could be taken as a rebound, but it was so inaccurate... Thus, traders could open a short position first and then a long position. There was a loss on the first trade, as the price failed to pass even 15 points in the right direction, and a small profit on the second trade, which made it possible to offset the loss on the first trade.
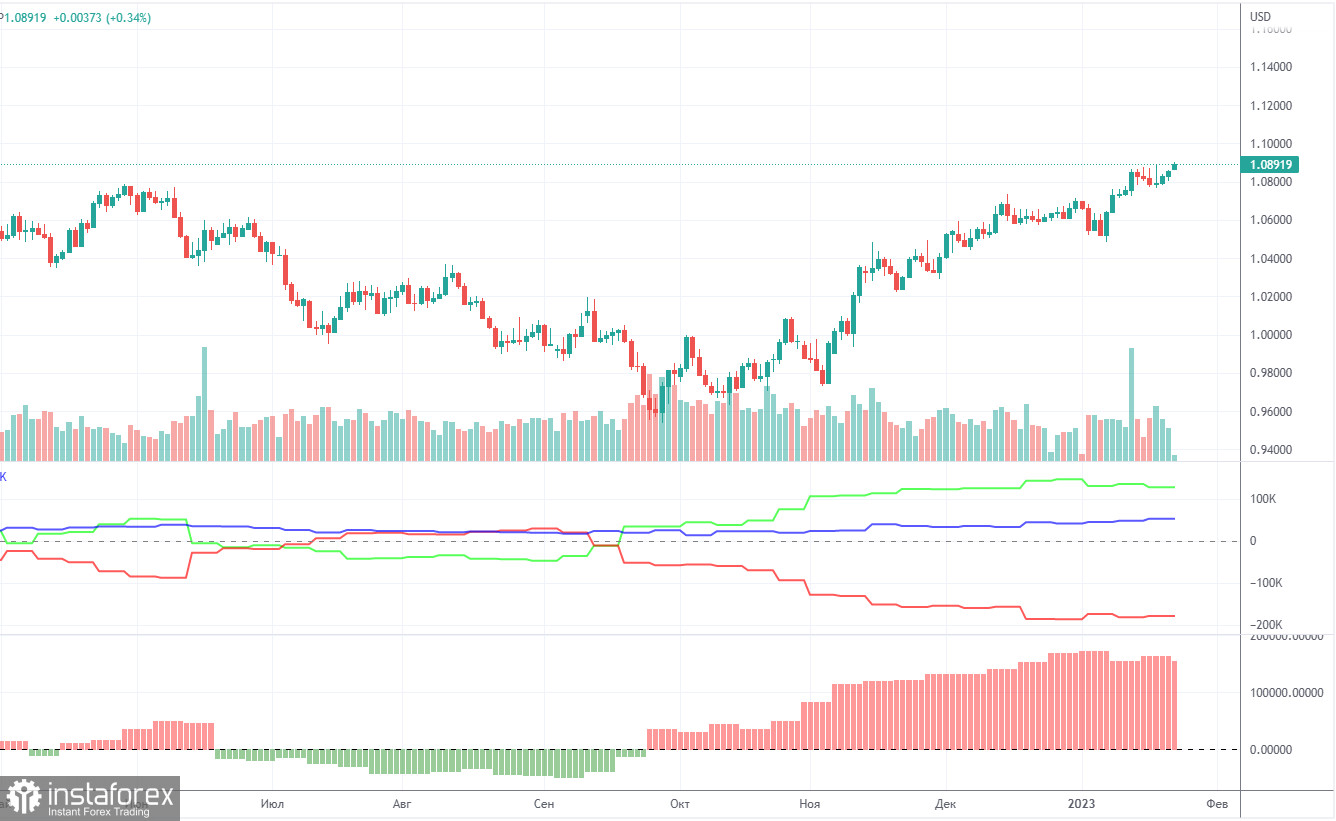
COT report

This image is no longer relevant

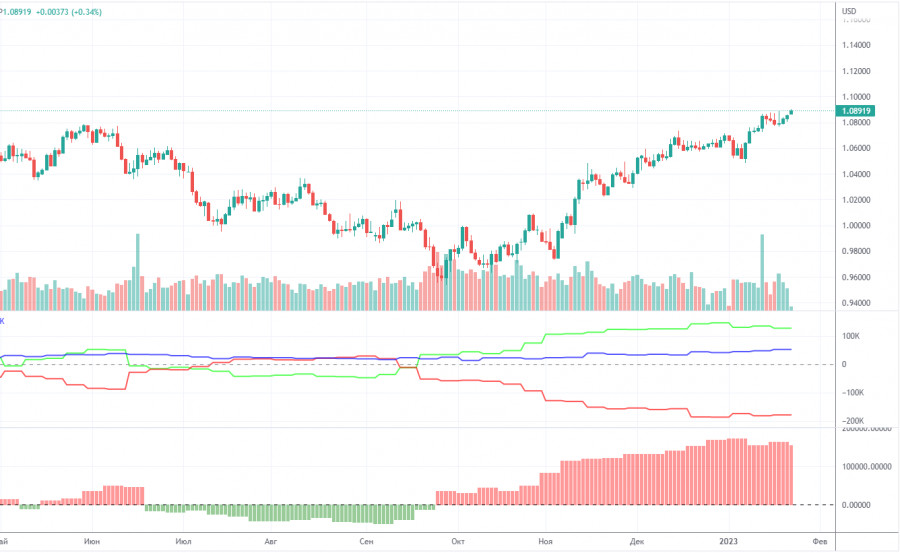
The COT reports for the euro in the last few months have been fully consistent with what is happening in the market. You can clearly see on the chart that the net position of big players (the second indicator) has been growing since early September. Around the same time, the euro started to grow. At this time, the net position of the non-commercial traders has been bullish and strengthens almost every week, but it is a rather high value that allows us to assume that the uptrend will end soon. Notably, the green and red lines of the first indicator have moved far apart from each other, which often precedes the end of the trend. During the given period, the number of long positions held by non-commercial traders decreased by 10,300, whereas the number of short positions fell by 2,300. Thus, the net positions decreased by 8,000. Now the number of long positions is higher than the number of short positions opened by non-commercial traders by 127,000. From a technical perspective, a bearish correction should have started a long time ago. In my opinion, this process can not continue for another 2 or 3 months. Even the net position indicator shows that we need to "unload" a bit, that is, to correct. The overall number of short orders exceeds the number of long orders by 52,000 (711,000 vs. 659,000).

H1 chart of EUR/USD

This image is no longer relevant

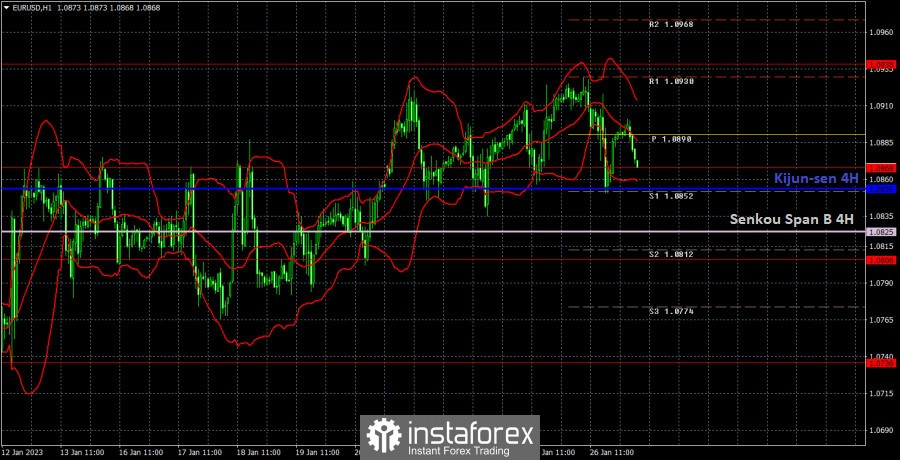
The technical picture on the one-hour chart remains unchanged. We can see that the pair maintains the bullish sentiment, and is located above the lines of the Ichimoku indicator. However, the pair was mostly flat, whether there was macro data or not. Thus, the euro can not rise, but it is not willing to fall as well. It looks like everything will be decided next week. We have set the last value of the Ichimoku indicator lines, because it can merge during a flat and can also be very weak. On Friday, the pair may trade at the following levels: 1.0658-1.0669, 1.0736, 1.0806, 1.0868, 1.0938, 1.1036, 1.1137 and also Senkou Span B lines (1.0825) and Kijun Sen (1.0854). Lines of the Ichimoku indicator may move during the day, which should be taken into account when determining trading signals. There are also support and resistance levels, but signals are not formed near these levels. Bounces and breakouts of the extreme levels and lines could act as signals. Don't forget about stop-loss orders, if the price covers 15 pips in the right direction. This will prevent you from losses in case of a false signal. On January 27, the EU will host another speech by European Central Bank President Christine Lagarde, of which there have been 4 or 5 over the past two weeks, and there will be several reports in America, not the most important ones.

What we see on the trading charts:

Price levels of support and resistance are thick red lines, near which the movement may end. They do not provide trading signals.

The Kijun-sen and Senkou Span B lines are the lines of the Ichimoku indicator, moved to the one-hour chart from the 4-hour one. They are strong lines.

Extreme levels are thin red lines from which the price bounced earlier. They provide trading signals.

Yellow lines are trend lines, trend channels, and any other technical patterns.

Indicator 1 on the COT charts reflects the net position size of each category of traders.

Indicator 2 on the COT charts reflects the net position size for the non-commercial group.

Paolo Greco,
Especialista em análise na InstaForex
© 2007-2025
Summary
Urgency
Analytic
Stanislav Polyanskiy
Start trade
Ganhe com as variações das taxas das criptomoedas com a InstaForex.
Baixe o MetaTrader 4 e abra a sua primeira operação.
  • Grand Choice
    Contest by
    InstaForex
    InstaForex always strives to help you
    fulfill your biggest dreams.
    PARTICIPE DO CONCURSO

Recommended Stories

EUR/USD: Plano de Negociação para a sessão europeia de 21 de julho. Relatórios de Compromisso dos Comerciantes (COT) (Análise das Negociações de Ontem). Correção do euro está perto do fim

EUR/USD: Plano de Negociação para a sessão europeia de 21 de julho. Relatórios de Compromisso dos Comerciantes (COT) (Análise das Negociações de Ontem). Correção do euro está perto

Miroslaw Bawulski 17:58 2025-07-21 UTC+2

How to Trade GBP/USD on July 11h? Simple Tips and Trade Analysis for Beginners

Na quinta-feira, o par GBP/USD manteve sua trajetória de queda, espelhando o comportamento do EUR/USD. O movimento dessas duas principais paridades cambiais tem sido praticamente idêntico ao longo da semana

Paolo Greco 17:34 2025-07-11 UTC+2

Como negociar EUR/USD em 11 de julho? Dicas simples e análise de negociação para iniciantes

Na quinta-feira, o par EUR/USD manteve seu movimento de queda moderado, em linha com a tendência atual. Temos reiterado essa mesma avaliação ao longo da semana porque, de fato, pouca

Paolo Greco 16:28 2025-07-11 UTC+2

O par de moedas EUR/USD foi negociado em baixa na segunda-feira, com o dólar americano mostrando uma força notável

Análise das negociações de segunda-feira: EUR/USD, Gráfico 1H Na segunda-feira, o par EUR/USD operou com viés de baixa, e o dólar norte-americano registrou um ganho relativamente forte. Como já mencionamos

Paolo Greco 16:13 2025-07-08 UTC+2

GBP/USD: Plano de Negociação para a Sessão dos E.U.A. de 7 de julho (Revisão das Negociações da Manhã)

Na minha previsão da manhã, destaquei o nível 1,3602 e planejei usá-lo para determinar os pontos de entrada no mercado. Vamos dar uma olhada no gráfico de 5 minutos

Miroslaw Bawulski 17:53 2025-07-07 UTC+2

EUR/USD: Plano de Negociação para a Sessão dos E.U. de 7 de julho (Revisão das Negociações da Manhã)

Na minha previsão da manhã, destaquei o nível 1,1749 e planejei basear as decisões de entrada no mercado em torno dele. Vamos dar uma olhada no gráfico de 5 minutos

Miroslaw Bawulski 17:44 2025-07-07 UTC+2

Como negociar o par EUR/USD em 4 de julho? Dicas simples e análise de negociação para iniciantes

Análise das operações de quinta-feira Gráfico 1H do EUR/USD O EUR/USD operou de forma estável ao longo da quinta-feira, tanto antes quanto depois da divulgação dos dados de emprego

Paolo Greco 14:57 2025-07-04 UTC+2

GBP/USD: Plano de Negociação para a Sessão dos E.U.A de 1º de julho (Revisão das Negociações da Manhã)

Na minha previsão da manhã, concentrei-me no nível 1,3766 e planejei tomar decisões de negociação a partir desse ponto. Vamos dar uma olhada no gráfico de 5 minutos

Miroslaw Bawulski 20:44 2025-07-01 UTC+2

EUR/USD: Plano de Negociação para a Sessão dos E.U. de 1º de julho (Revisão das Negociações da Manhã)

Na minha previsão da manhã, destaquei o nível de 1,1806 como ponto de referência para tomadas de decisão nas operações. Vamos dar uma olhada no gráfico de 5 minutos

Miroslaw Bawulski 20:24 2025-07-01 UTC+2
Não pode falar agora?
Faça sua pergunta no chat.
Widget callback
 

Dear visitor,

Your IP address shows that you are currently located in the USA. If you are a resident of the United States, you are prohibited from using the services of InstaFintech Group including online trading, online transfers, deposit/withdrawal of funds, etc.

If you think you are seeing this message by mistake and your location is not the US, kindly proceed to the website. Otherwise, you must leave the website in order to comply with government restrictions.

Why does your IP address show your location as the USA?

  • - you are using a VPN provided by a hosting company based in the United States;
  • - your IP does not have proper WHOIS records;
  • - an error occurred in the WHOIS geolocation database.

Please confirm whether you are a US resident or not by clicking the relevant button below. If you choose the wrong option, being a US resident, you will not be able to open an account with InstaForex anyway.

We are sorry for any inconvenience caused by this message.