

signal strength 1 of 5
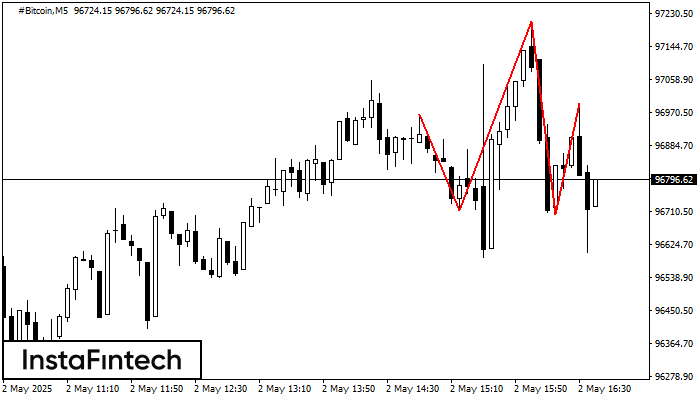
The technical pattern called Head and Shoulders has appeared on the chart of #Bitcoin M5. There are weighty reasons to suggest that the price will surpass the Neckline 96714.23/96704.41 after the right shoulder has been formed. So, the trend is set to change with the price heading for 96704.26.
The M5 and M15 time frames may have more false entry points.
- All
- Double Top
- Flag
- Head and Shoulders
- Pennant
- Rectangle
- Triangle
- Triple top
- All
- #AAPL
- #AMZN
- #Bitcoin
- #EBAY
- #FB
- #GOOG
- #INTC
- #KO
- #MA
- #MCD
- #MSFT
- #NTDOY
- #PEP
- #TSLA
- #TWTR
- AUDCAD
- AUDCHF
- AUDJPY
- AUDUSD
- EURCAD
- EURCHF
- EURGBP
- EURJPY
- EURNZD
- EURRUB
- EURUSD
- GBPAUD
- GBPCHF
- GBPJPY
- GBPUSD
- GOLD
- NZDCAD
- NZDCHF
- NZDJPY
- NZDUSD
- SILVER
- USDCAD
- USDCHF
- USDJPY
- USDRUB
- All
- M5
- M15
- M30
- H1
- D1
- All
- Buy
- Sale
- All
- 1
- 2
- 3
- 4
- 5
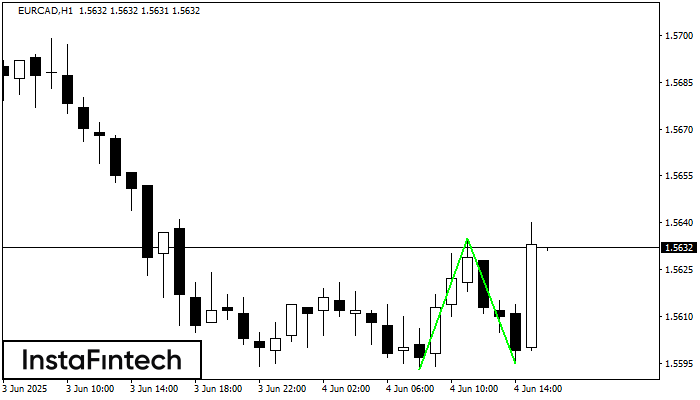
The Double Bottom pattern has been formed on EURCAD H1; the upper boundary is 1.5635; the lower boundary is 1.5595. The width of the pattern is 42 points. In case
Open chart in a new window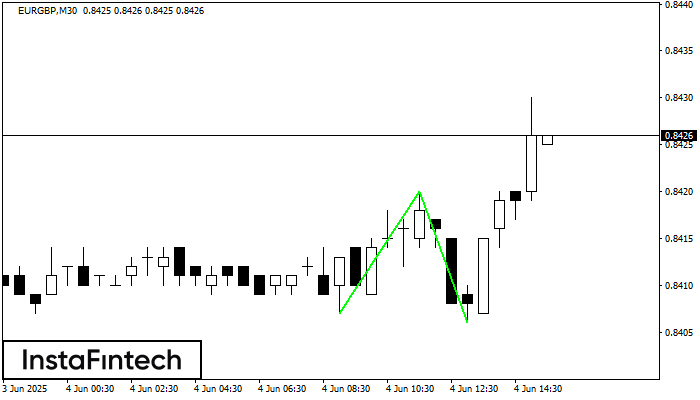
The Double Bottom pattern has been formed on EURGBP M30. Characteristics: the support level 0.8407; the resistance level 0.8420; the width of the pattern 13 points. If the resistance level
Open chart in a new window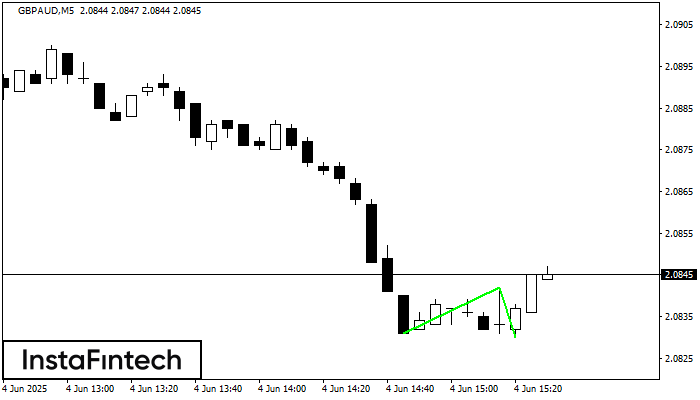
The Double Bottom pattern has been formed on GBPAUD M5. Characteristics: the support level 2.0831; the resistance level 2.0842; the width of the pattern 11 points. If the resistance level
The M5 and M15 time frames may have more false entry points.
Open chart in a new window


