signal strength 1 of 5
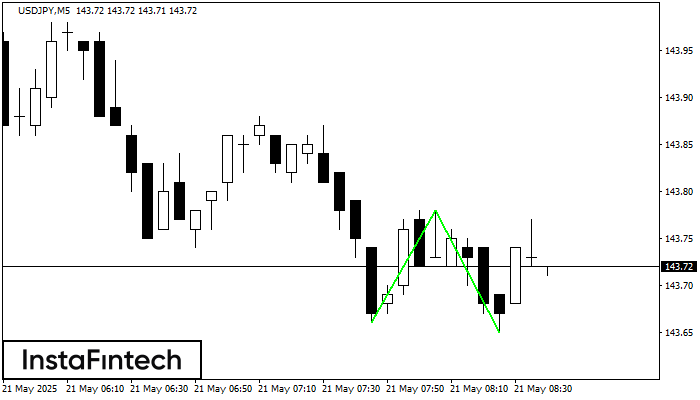
The Double Bottom pattern has been formed on USDJPY M5; the upper boundary is 143.78; the lower boundary is 143.65. The width of the pattern is 12 points. In case of a break of the upper boundary 143.78, a change in the trend can be predicted where the width of the pattern will coincide with the distance to a possible take profit level.
The M5 and M15 time frames may have more false entry points.
- All
- Double Top
- Flag
- Head and Shoulders
- Pennant
- Rectangle
- Triangle
- Triple top
- All
- #AAPL
- #AMZN
- #Bitcoin
- #EBAY
- #FB
- #GOOG
- #INTC
- #KO
- #MA
- #MCD
- #MSFT
- #NTDOY
- #PEP
- #TSLA
- #TWTR
- AUDCAD
- AUDCHF
- AUDJPY
- AUDUSD
- EURCAD
- EURCHF
- EURGBP
- EURJPY
- EURNZD
- EURRUB
- EURUSD
- GBPAUD
- GBPCHF
- GBPJPY
- GBPUSD
- GOLD
- NZDCAD
- NZDCHF
- NZDJPY
- NZDUSD
- SILVER
- USDCAD
- USDCHF
- USDJPY
- USDRUB
- All
- M5
- M15
- M30
- H1
- D1
- All
- Buy
- Sale
- All
- 1
- 2
- 3
- 4
- 5
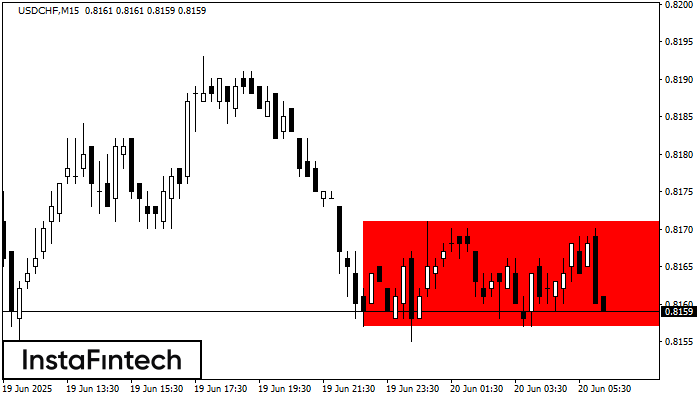
Según el gráfico de M15, USDCHF formó el Rectángulo Bajista. Este tipo de patrón indica la continuación de una tendencia. Esto consiste de dos niveles: resistencia 0.8171 - 0.0000
Los marcos de tiempo M5 y M15 pueden tener más puntos de entrada falsos.
Open chart in a new window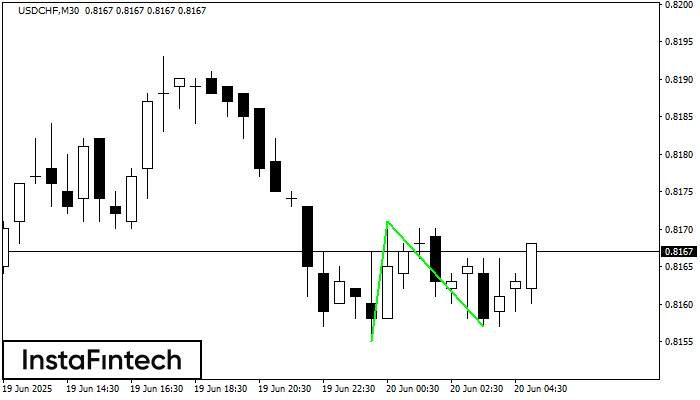
El patrón Doble Piso ha sido formado en USDCHF M30. Esta formación señala una reversión de la tendencia de bajista a alcista. La señal es que se debe abrir
Open chart in a new window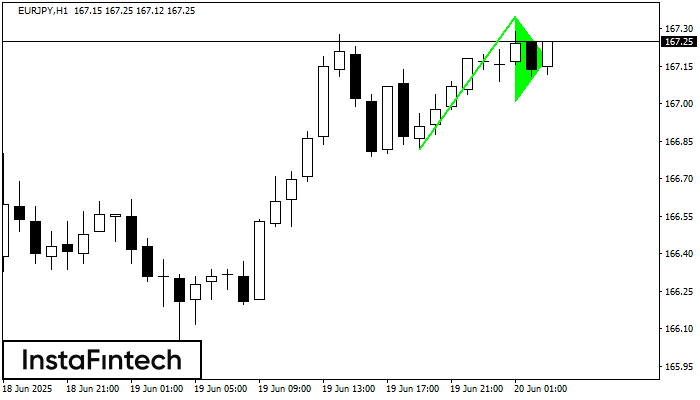
El patrón gráfico Banderín alcista se ha formado en el instrumento EURJPY H1. Este tipo de patrón entra en la categoría de patrones de continuación. En este caso
Open chart in a new window