


signal strength 2 of 5
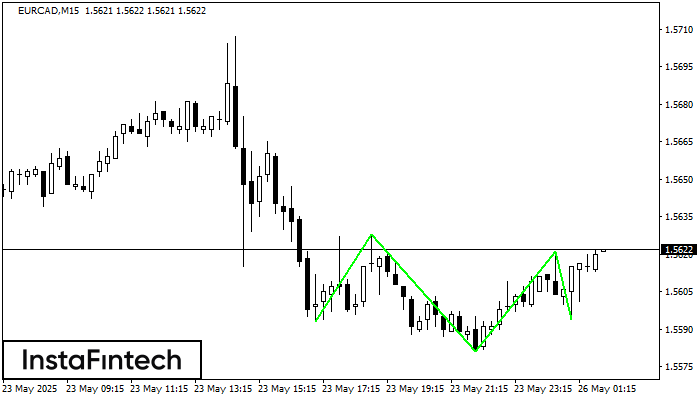
According to the chart of M15, EURCAD produced the pattern termed the Inverse Head and Shoulder. The Head is fixed at 1.5581 while the median line of the Neck is set at 1.5628/1.5621. The formation of the Inverse Head and Shoulder Pattern clearly indicates a reversal of the downward trend. In means that in case the scenario comes true, the price of EURCAD will go towards 1.5644.
The M5 and M15 time frames may have more false entry points.
- All
- Double Top
- Flag
- Head and Shoulders
- Pennant
- Rectangle
- Triangle
- Triple top
- All
- #AAPL
- #AMZN
- #Bitcoin
- #EBAY
- #FB
- #GOOG
- #INTC
- #KO
- #MA
- #MCD
- #MSFT
- #NTDOY
- #PEP
- #TSLA
- #TWTR
- AUDCAD
- AUDCHF
- AUDJPY
- AUDUSD
- EURCAD
- EURCHF
- EURGBP
- EURJPY
- EURNZD
- EURRUB
- EURUSD
- GBPAUD
- GBPCHF
- GBPJPY
- GBPUSD
- GOLD
- NZDCAD
- NZDCHF
- NZDJPY
- NZDUSD
- SILVER
- USDCAD
- USDCHF
- USDJPY
- USDRUB
- All
- M5
- M15
- M30
- H1
- D1
- All
- Buy
- Sale
- All
- 1
- 2
- 3
- 4
- 5
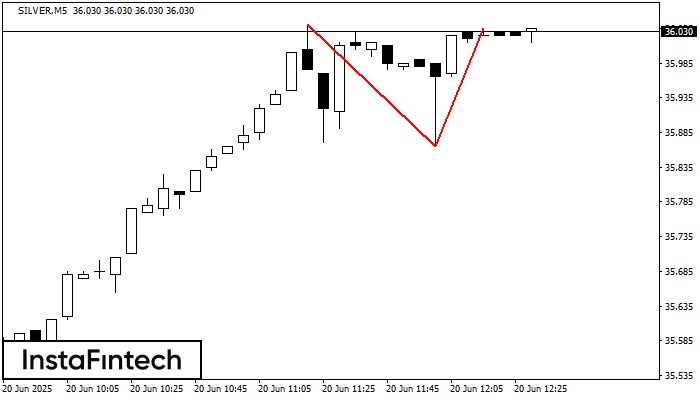
On the chart of SILVER M5 the Double Top reversal pattern has been formed. Characteristics: the upper boundary 36.03; the lower boundary 35.87; the width of the pattern 170 points
The M5 and M15 time frames may have more false entry points.
Open chart in a new window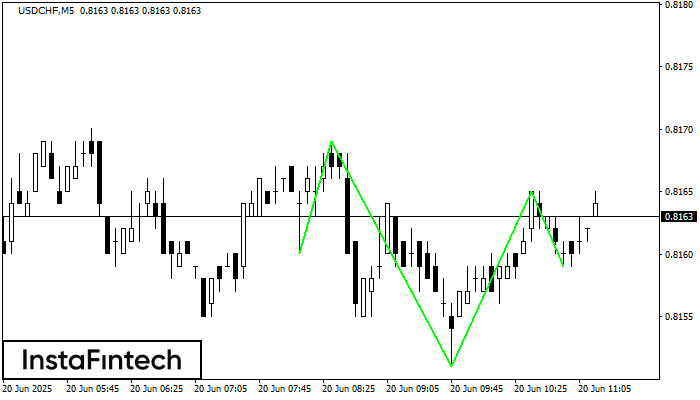
According to M5, USDCHF is shaping the technical pattern – the Inverse Head and Shoulder. In case the Neckline 0.8169/0.8165 is broken out, the instrument is likely to move toward
The M5 and M15 time frames may have more false entry points.
Open chart in a new window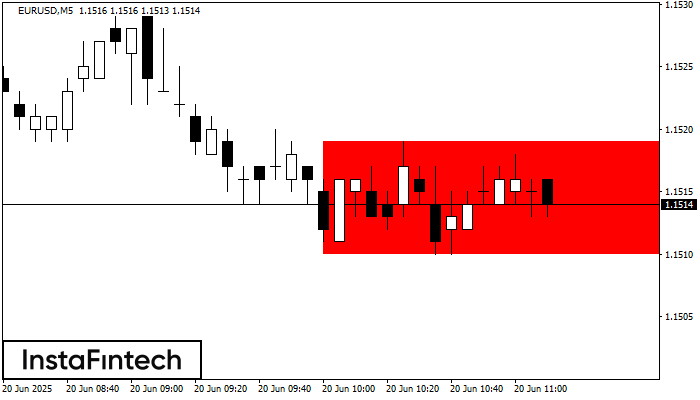
According to the chart of M5, EURUSD formed the Bearish Rectangle. The pattern indicates a trend continuation. The upper border is 1.1519, the lower border is 1.1510. The signal means
The M5 and M15 time frames may have more false entry points.
Open chart in a new window


