


signal strength 1 of 5
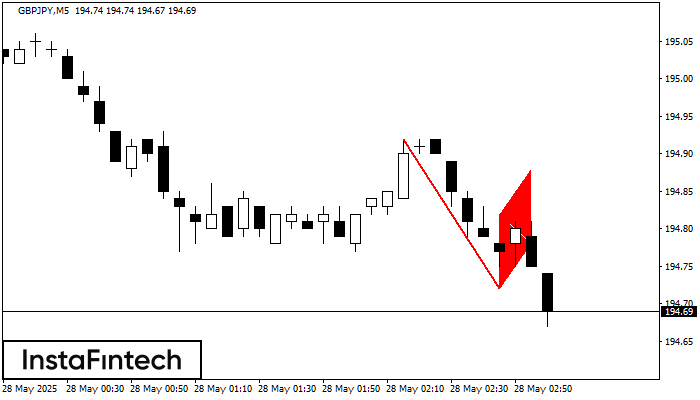
The Bearish Flag pattern has been formed on the chart GBPJPY M5. Therefore, the downwards trend is likely to continue in the nearest term. As soon as the price breaks below the low at 194.72, traders should enter the market.
The M5 and M15 time frames may have more false entry points.
- All
- Double Top
- Flag
- Head and Shoulders
- Pennant
- Rectangle
- Triangle
- Triple top
- All
- #AAPL
- #AMZN
- #Bitcoin
- #EBAY
- #FB
- #GOOG
- #INTC
- #KO
- #MA
- #MCD
- #MSFT
- #NTDOY
- #PEP
- #TSLA
- #TWTR
- AUDCAD
- AUDCHF
- AUDJPY
- AUDUSD
- EURCAD
- EURCHF
- EURGBP
- EURJPY
- EURNZD
- EURRUB
- EURUSD
- GBPAUD
- GBPCHF
- GBPJPY
- GBPUSD
- GOLD
- NZDCAD
- NZDCHF
- NZDJPY
- NZDUSD
- SILVER
- USDCAD
- USDCHF
- USDJPY
- USDRUB
- All
- M5
- M15
- M30
- H1
- D1
- All
- Buy
- Sale
- All
- 1
- 2
- 3
- 4
- 5
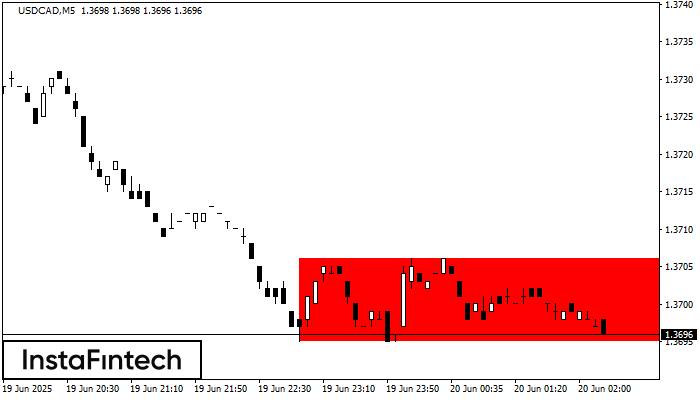
According to the chart of M5, USDCAD formed the Bearish Rectangle which is a pattern of a trend continuation. The pattern is contained within the following borders: lower border 1.3695
The M5 and M15 time frames may have more false entry points.
Open chart in a new window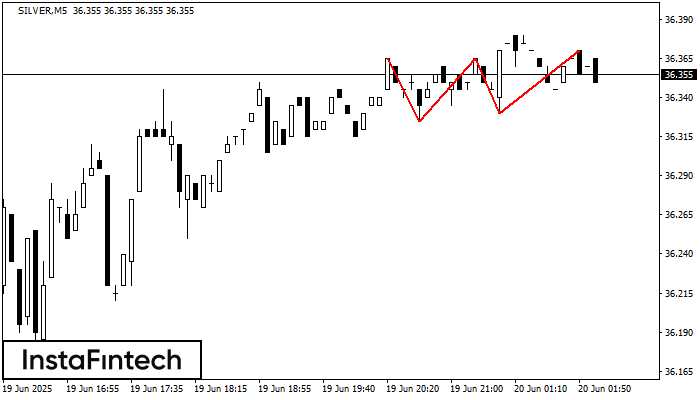
The Triple Top pattern has formed on the chart of the SILVER M5 trading instrument. It is a reversal pattern featuring the following characteristics: resistance level -5, support level -5
The M5 and M15 time frames may have more false entry points.
Open chart in a new window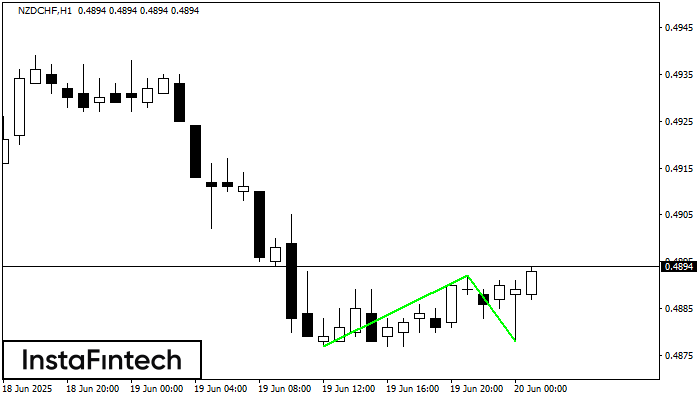
The Double Bottom pattern has been formed on NZDCHF H1. Characteristics: the support level 0.4877; the resistance level 0.4892; the width of the pattern 15 points. If the resistance level
Open chart in a new window


