signal strength 1 of 5
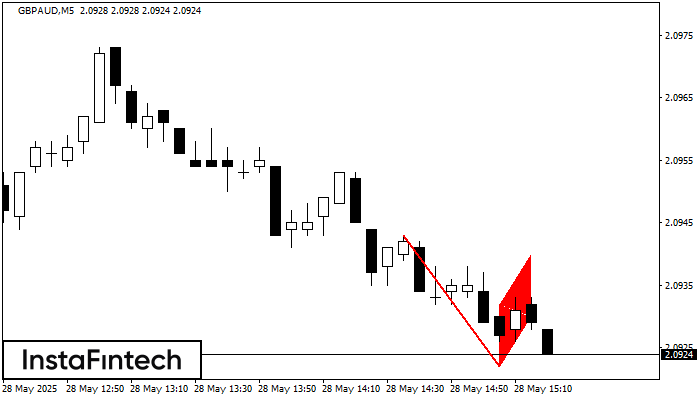
The Bearish Flag pattern has been formed on the chart GBPAUD M5. Therefore, the downwards trend is likely to continue in the nearest term. As soon as the price breaks below the low at 2.0922, traders should enter the market.
The M5 and M15 time frames may have more false entry points.
See Also
- All
- Double Top
- Flag
- Head and Shoulders
- Pennant
- Rectangle
- Triangle
- Triple top
- All
- #AAPL
- #AMZN
- #Bitcoin
- #EBAY
- #FB
- #GOOG
- #INTC
- #KO
- #MA
- #MCD
- #MSFT
- #NTDOY
- #PEP
- #TSLA
- #TWTR
- AUDCAD
- AUDCHF
- AUDJPY
- AUDUSD
- EURCAD
- EURCHF
- EURGBP
- EURJPY
- EURNZD
- EURRUB
- EURUSD
- GBPAUD
- GBPCHF
- GBPJPY
- GBPUSD
- GOLD
- NZDCAD
- NZDCHF
- NZDJPY
- NZDUSD
- SILVER
- USDCAD
- USDCHF
- USDJPY
- USDRUB
- All
- M5
- M15
- M30
- H1
- D1
- All
- Buy
- Sale
- All
- 1
- 2
- 3
- 4
- 5
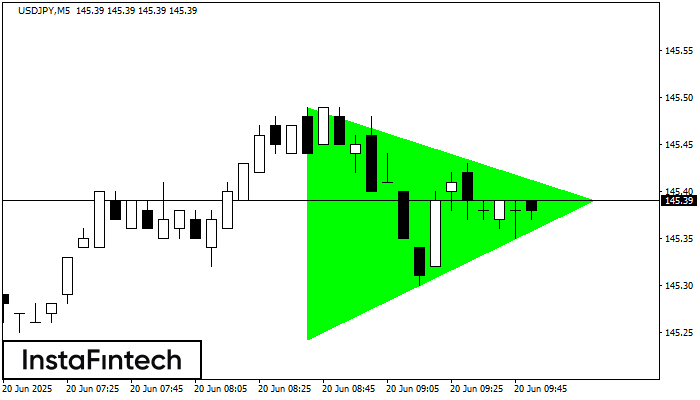
According to the chart of M5, USDJPY formed the Bullish Symmetrical Triangle pattern. The lower border of the pattern touches the coordinates 145.24/145.39 whereas the upper border goes across 145.49/145.39
The M5 and M15 time frames may have more false entry points.
Open chart in a new window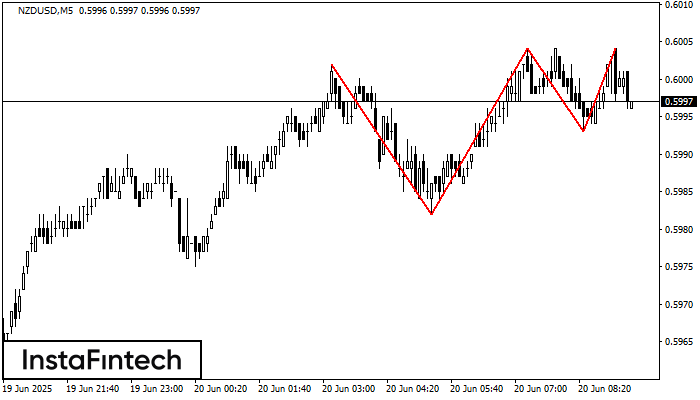
On the chart of the NZDUSD M5 trading instrument, the Triple Top pattern that signals a trend change has formed. It is possible that after formation of the third peak
The M5 and M15 time frames may have more false entry points.
Open chart in a new window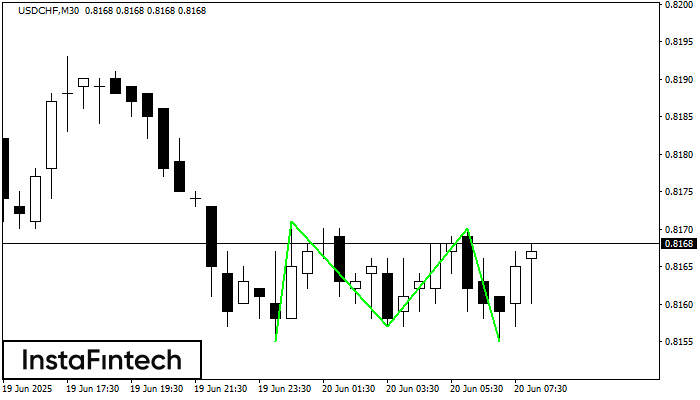
The Triple Bottom pattern has been formed on USDCHF M30. It has the following characteristics: resistance level 0.8171/0.8170; support level 0.8155/0.8155; the width is 16 points. In the event
Open chart in a new window