signal strength 1 of 5

According to the chart of M5, #Bitcoin produced the pattern termed the Inverse Head and Shoulder. The Head is fixed at 102549.85 while the median line of the Neck is set at 103359.60/103319.80. The formation of the Inverse Head and Shoulder Pattern clearly indicates a reversal of the downward trend. In means that in case the scenario comes true, the price of #Bitcoin will go towards 103320.00.
The M5 and M15 time frames may have more false entry points.
- All
- Double Top
- Flag
- Head and Shoulders
- Pennant
- Rectangle
- Triangle
- Triple top
- All
- #AAPL
- #AMZN
- #Bitcoin
- #EBAY
- #FB
- #GOOG
- #INTC
- #KO
- #MA
- #MCD
- #MSFT
- #NTDOY
- #PEP
- #TSLA
- #TWTR
- AUDCAD
- AUDCHF
- AUDJPY
- AUDUSD
- EURCAD
- EURCHF
- EURGBP
- EURJPY
- EURNZD
- EURRUB
- EURUSD
- GBPAUD
- GBPCHF
- GBPJPY
- GBPUSD
- GOLD
- NZDCAD
- NZDCHF
- NZDJPY
- NZDUSD
- SILVER
- USDCAD
- USDCHF
- USDJPY
- USDRUB
- All
- M5
- M15
- M30
- H1
- D1
- All
- Buy
- Sale
- All
- 1
- 2
- 3
- 4
- 5
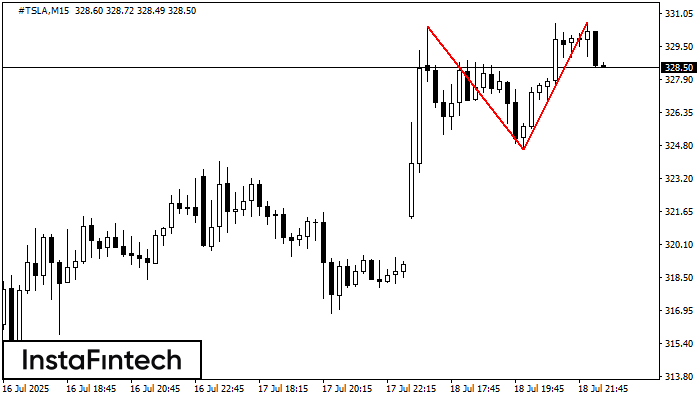
The Double Top reversal pattern has been formed on #TSLA M15. Characteristics: the upper boundary 330.45; the lower boundary 324.60; the width of the pattern is 603 points. Sell trades
The M5 and M15 time frames may have more false entry points.
Open chart in a new window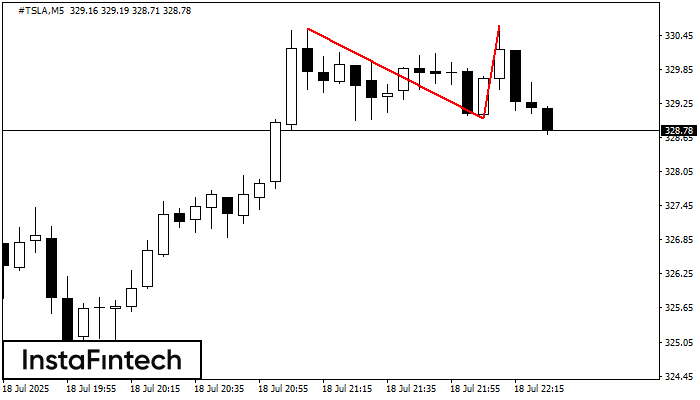
The Double Top pattern has been formed on #TSLA M5. It signals that the trend has been changed from upwards to downwards. Probably, if the base of the pattern 328.99
The M5 and M15 time frames may have more false entry points.
Open chart in a new window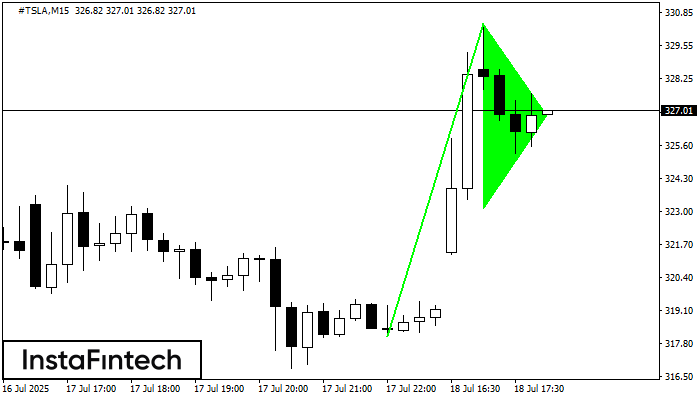
The Bullish pennant signal – Trading instrument #TSLA M15, continuation pattern. Forecast: it is possible to set up a buy position above the pattern’s high of 330.45, with the prospect
The M5 and M15 time frames may have more false entry points.
Open chart in a new window