

signal strength 1 of 5
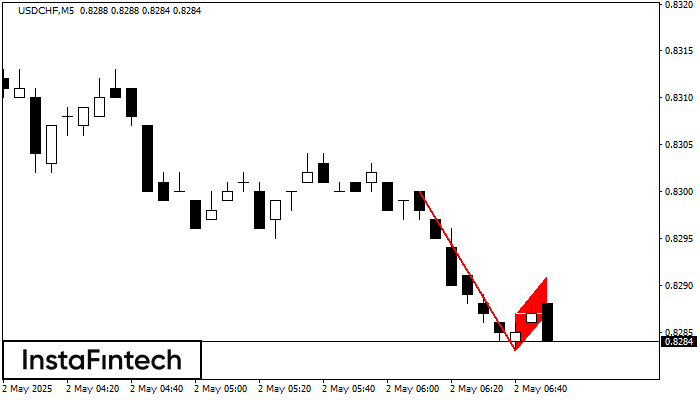
The Bearish Flag pattern has been formed on USDCHF at M5. The lower boundary of the pattern is located at 0.8283/0.8287 while the upper boundary lies at 0.8287/0.8291. The projection of the flagpole is 17 points. This formation signals that the downward trend is most likely to continue. Therefore, if the level of 0.8283 is broken, the price will move further downwards.
The M5 and M15 time frames may have more false entry points.
- All
- Double Top
- Flag
- Head and Shoulders
- Pennant
- Rectangle
- Triangle
- Triple top
- All
- #AAPL
- #AMZN
- #Bitcoin
- #EBAY
- #FB
- #GOOG
- #INTC
- #KO
- #MA
- #MCD
- #MSFT
- #NTDOY
- #PEP
- #TSLA
- #TWTR
- AUDCAD
- AUDCHF
- AUDJPY
- AUDUSD
- EURCAD
- EURCHF
- EURGBP
- EURJPY
- EURNZD
- EURRUB
- EURUSD
- GBPAUD
- GBPCHF
- GBPJPY
- GBPUSD
- GOLD
- NZDCAD
- NZDCHF
- NZDJPY
- NZDUSD
- SILVER
- USDCAD
- USDCHF
- USDJPY
- USDRUB
- All
- M5
- M15
- M30
- H1
- D1
- All
- Buy
- Sale
- All
- 1
- 2
- 3
- 4
- 5
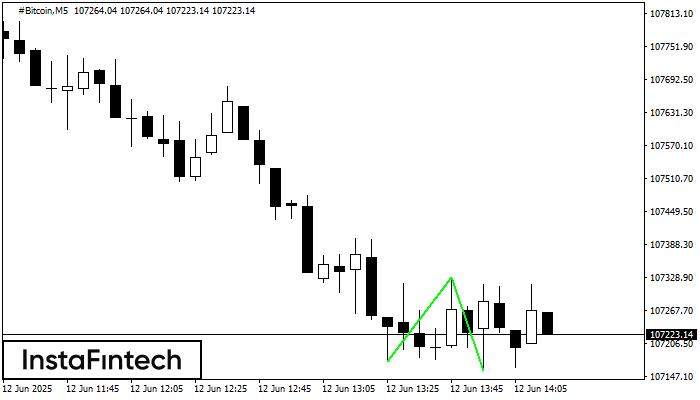
The Double Bottom pattern has been formed on #Bitcoin M5. Characteristics: the support level 107174.44; the resistance level 107328.71; the width of the pattern 15427 points. If the resistance level
The M5 and M15 time frames may have more false entry points.
Open chart in a new window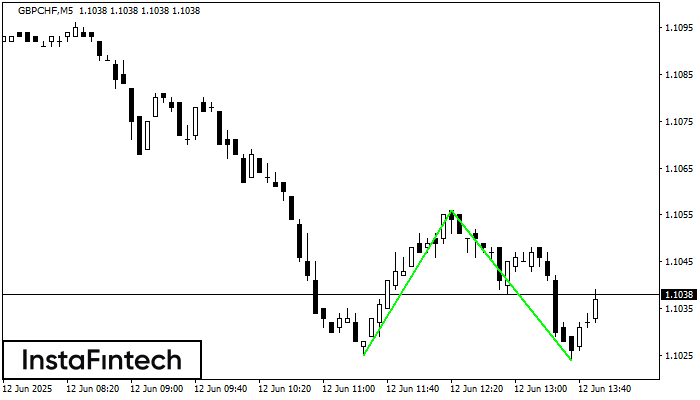
The Double Bottom pattern has been formed on GBPCHF M5. This formation signals a reversal of the trend from downwards to upwards. The signal is that a buy trade should
The M5 and M15 time frames may have more false entry points.
Open chart in a new window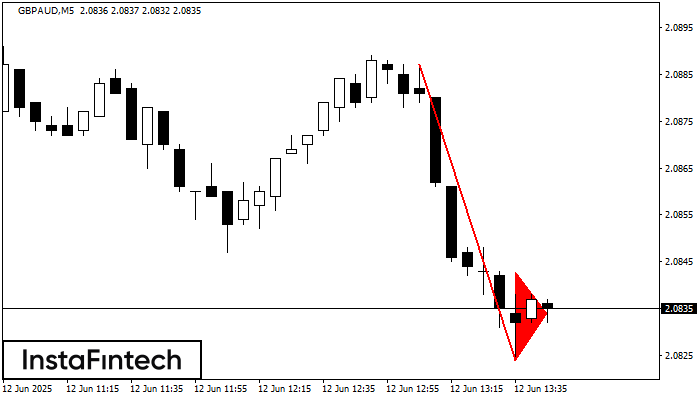
The Bearish pennant pattern has formed on the GBPAUD M5 chart. The pattern signals continuation of the downtrend in case the pennant’s low of 2.0824 is broken through. Recommendations: Place
The M5 and M15 time frames may have more false entry points.
Open chart in a new window


