signal strength 4 of 5
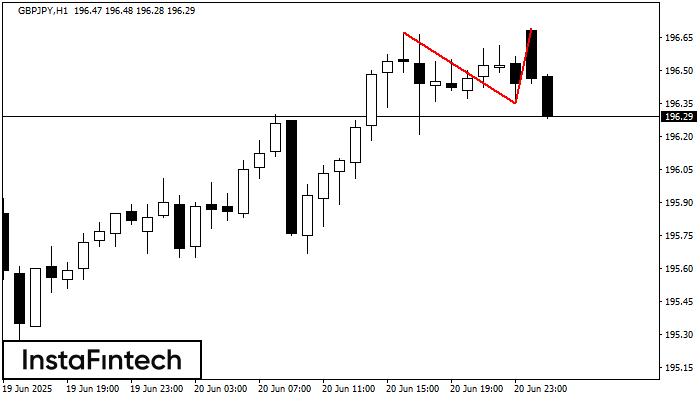
On the chart of GBPJPY H1 the Double Top reversal pattern has been formed. Characteristics: the upper boundary 196.69; the lower boundary 196.35; the width of the pattern 34 points. The signal: a break of the lower boundary will cause continuation of the downward trend targeting the 195.95 level.
See Also
- All
- Double Top
- Flag
- Head and Shoulders
- Pennant
- Rectangle
- Triangle
- Triple top
- All
- #AAPL
- #AMZN
- #Bitcoin
- #EBAY
- #FB
- #GOOG
- #INTC
- #KO
- #MA
- #MCD
- #MSFT
- #NTDOY
- #PEP
- #TSLA
- #TWTR
- AUDCAD
- AUDCHF
- AUDJPY
- AUDUSD
- EURCAD
- EURCHF
- EURGBP
- EURJPY
- EURNZD
- EURRUB
- EURUSD
- GBPAUD
- GBPCHF
- GBPJPY
- GBPUSD
- GOLD
- NZDCAD
- NZDCHF
- NZDJPY
- NZDUSD
- SILVER
- USDCAD
- USDCHF
- USDJPY
- USDRUB
- All
- M5
- M15
- M30
- H1
- D1
- All
- Buy
- Sale
- All
- 1
- 2
- 3
- 4
- 5
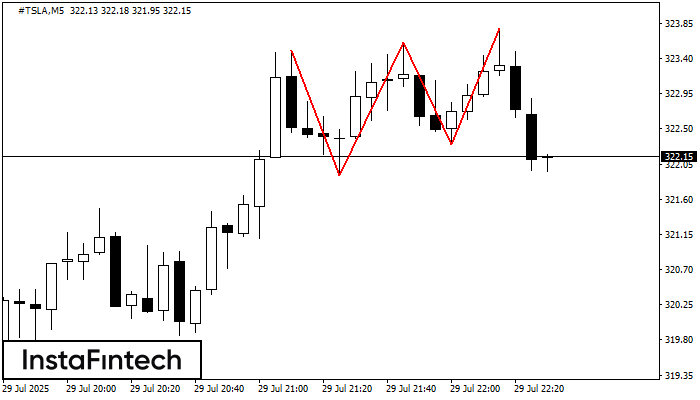
The Triple Top pattern has formed on the chart of the #TSLA M5 trading instrument. It is a reversal pattern featuring the following characteristics: resistance level -28, support level -40
The M5 and M15 time frames may have more false entry points.
Open chart in a new window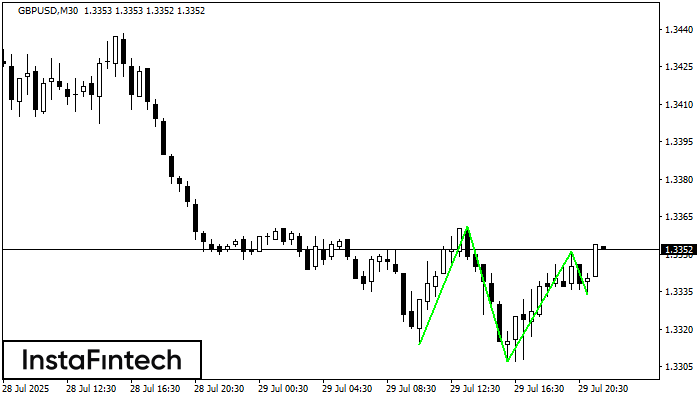
According to the chart of M30, GBPUSD produced the pattern termed the Inverse Head and Shoulder. The Head is fixed at 1.3307 while the median line of the Neck
Open chart in a new window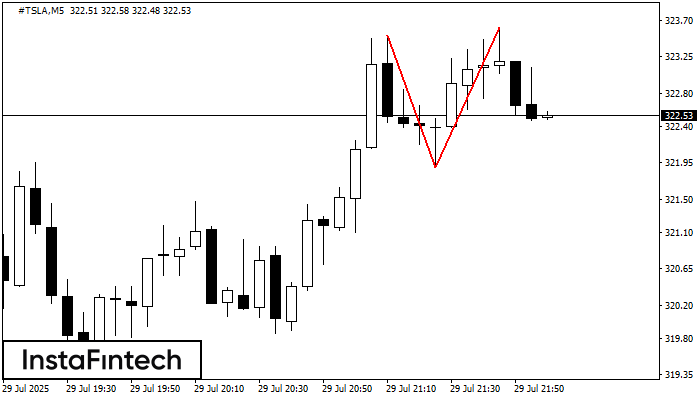
On the chart of #TSLA M5 the Double Top reversal pattern has been formed. Characteristics: the upper boundary 323.61; the lower boundary 321.90; the width of the pattern 171 points
The M5 and M15 time frames may have more false entry points.
Open chart in a new window