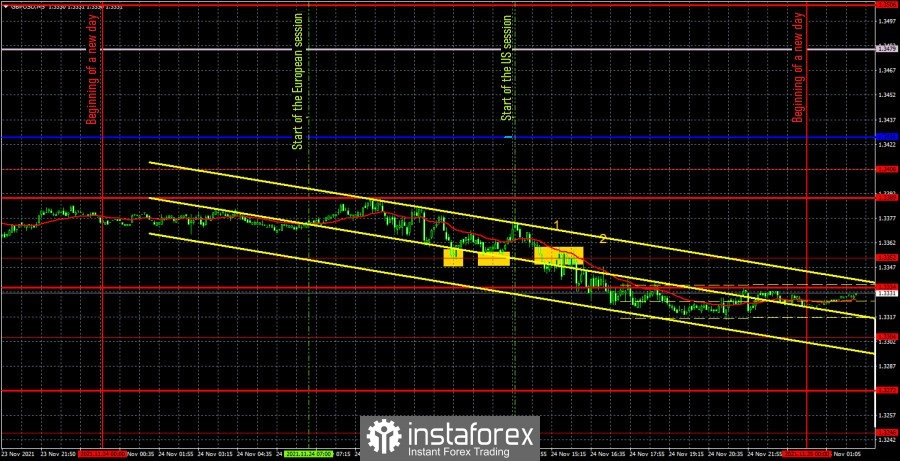
GBP/USD 5M

The GBP/USD pair continued to trade absolutely indistinctly, but at the same time maintained a downward trend. Pay attention to the chart above, which clearly shows the intraday movement of the pair. Every 20 points down, there was a 15-point retracement upward. Volatility, as for the pound/dollar pair, was low on Wednesday - only 66 points. There was a downward movement, but very weak, and all trading signals formed only around one extreme level 1.3352. And since there were more than one signals, these are actually signs of a flat, not a trend movement. In general, it was very inconvenient to trade, in contrast to the previous day. It should also be noted right away that there was not a single macroeconomic report or other important event in the UK yesterday. The numbers "1" and "2" in the chart mark the time when macroeconomic statistics in the United States was published, which practically had no effect on the pair's movement and which we talked about in our review on the euro/dollar. We can single out only reports on GDP (+ 2.1% q/q vs. forecast + 2.2% q/q) and on orders for durable goods (-0.5% m/m vs. forecast + 0.2% m/m). It turns out that both of the most important reports were not in favor of the US currency, but nevertheless, they did not stop its strengthening. Now let's move on to examining trading signals. The first two trading signals can be considered together as they were identical. Rebounds from the 1.3352 level, which should have been worked out with a long position. The pair could not go up either after the first or after the second 20 points, so Stop Loss was not set to breakeven. A long position was manually closed when the pair settled below 1.3352 and thus formed a sell signal. It should also have been worked out, but with a short position. The deal turned out to be more successful than the first one and brought about 16 points of profit - it should have been manually closed in the late afternoon. A loss of 12 points was received on the first trade.
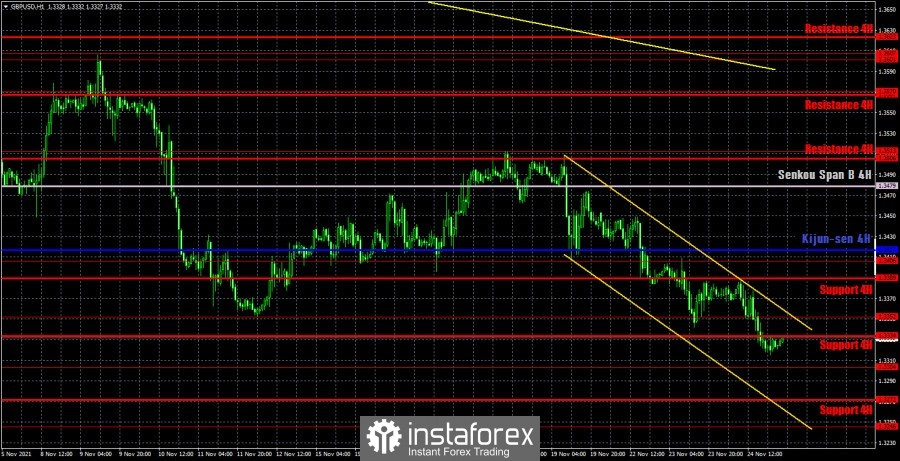
GBP/USD 1H

On the hourly timeframe, the pound/dollar pair continues its downward movement, and in addition to the downward trend line, a downward trend channel has also formed, which has a larger slope. Thus, despite all the nondescript movements on the 5-minute TF, the movement looks very good on the higher TFs. If we take into account the 4-hour TF, then it is now very good to trade there, as it assumes a longer-term holding of positions than intraday. We distinguish the following important levels on November 25: 1.3246, 1.3304, 1.3352, 1.3406, 1.3513. Senkou Span B (1.3479) and Kijun-sen (1.3417) lines can also be signal sources. Signals can be "rebounds" and "breakthroughs" of these levels and lines. It is recommended to set the Stop Loss level at breakeven when the price passes 20 points in the right direction. The Ichimoku indicator lines can move during the day, which should be taken into account when looking for trading signals. Bank of England Governor Andrew Bailey will speak in the UK on Thursday, which is unlikely to be of any interest to the markets. It should be remembered that not every speech by the head of the central bank provokes at least some kind of reaction, and not every speech gives the markets important information. Apart from Bailey's speech, there won't be any other big events tonight.
We recommend you to familiarize yourself:
Overview of the EUR/USD pair. November 25. "Coronavirus" swept over Germany. The locomotive of the European economy may stop...
Overview of the GBP/USD pair. November 25. A year has passed. The UK and EU are still in talks. The rhetoric of Maros Sefcovic does not change.
Forecast and trading signals for EUR/USD for November 25. Detailed analysis of the movement of the pair and trade deals.
COT report
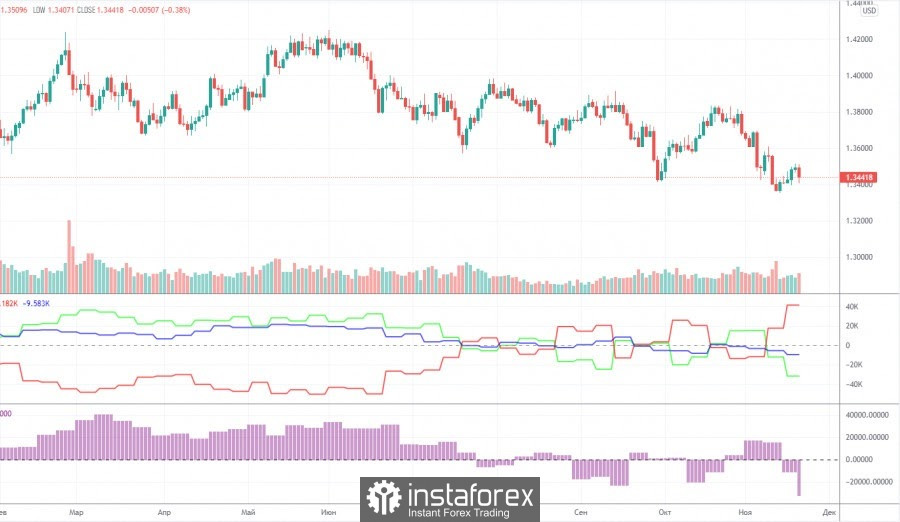
The mood of professional traders became much more bearish during the last reporting week. However, this should not be surprising, since the mood of major players has been constantly changing over the past few months, which perfectly reflects the first indicator in the chart above. The green and red lines, which indicate the net positions (in other words, the mood) of non-commercial and commercial traders, constantly change the direction of movement and constantly change their position relative to the zero level. The last reporting week only confirmed us in these conclusions. The green line has dropped significantly again, and the red line has increased significantly, although a couple of weeks ago it was the opposite. Thus, formally, the mood of professional traders has become more bearish, but in reality it changes every couple of weeks, so it is impossible to make a long-term conclusion. The non-commercial group closed 4,000 buy contracts (longs) and opened 17,000 sell contracts (shorts) during the reporting week. Thus, the net position decreased by 21,000 contracts at once, which is a lot for the pound. However, this does not matter much, since the net position of non-commercial traders also constantly jumps up and down, which is eloquently signaled by the second indicator in the chart above. It should also be noted that in the long term, the pound/dollar exchange rate itself also constantly jumps up and down. Thus, it is not possible to make a long-term forecast based on COT reports.
Explanations for the chart:
Support and Resistance Levels are the levels that serve as targets when buying or selling the pair. You can place Take Profit near these levels.
Kijun-sen and Senkou Span B lines are lines of the Ichimoku indicator transferred to the hourly timeframe from the 4-hour one.
Support and resistance areas are areas from which the price has repeatedly rebounded off.
Yellow lines are trend lines, trend channels and any other technical patterns.
Indicator 1 on the COT charts is the size of the net position of each category of traders.
Indicator 2 on the COT charts is the size of the net position for the non-commercial group.