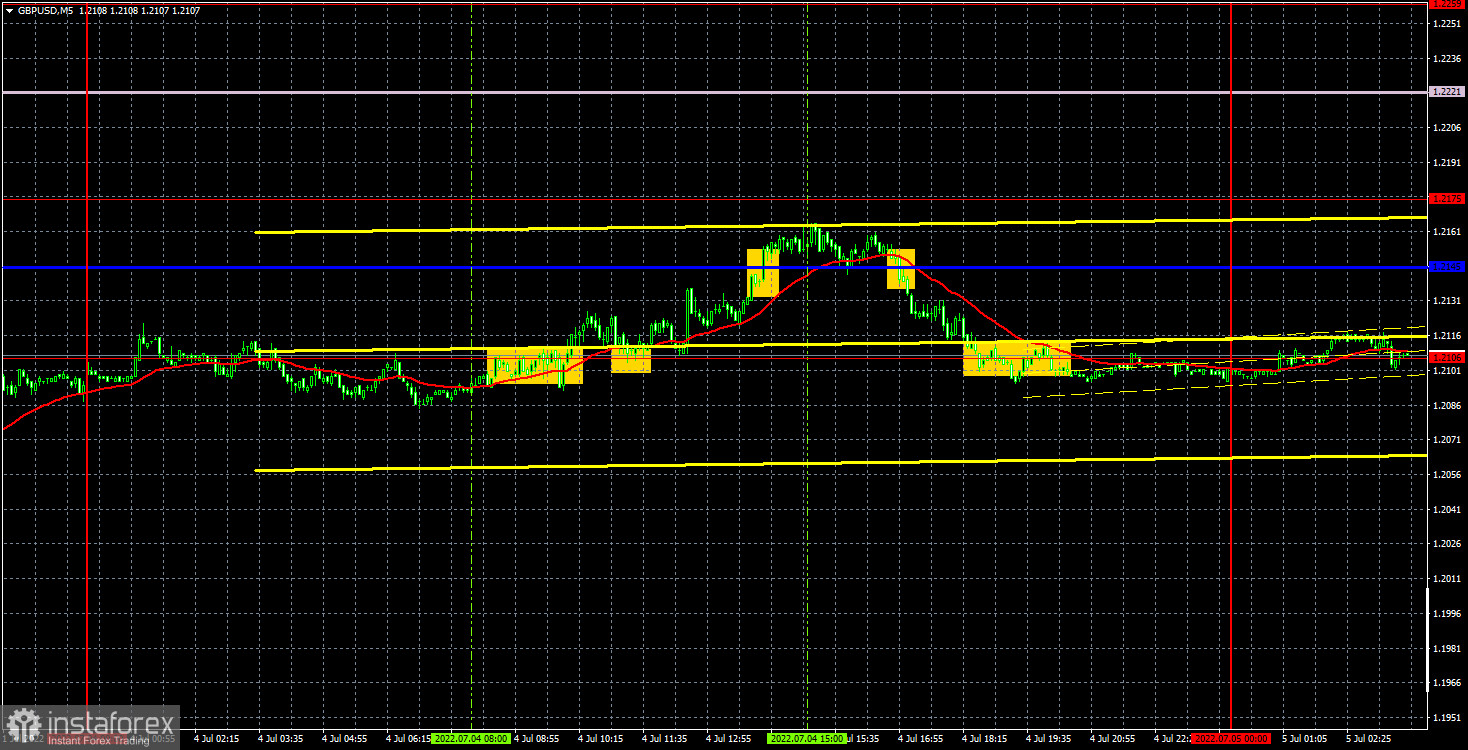
GBP/USD 5M
The GBP/USD currency pair tried to start a new round of correction on Monday, but gave up very quickly. In fact, the upward movement ended near the critical line, which is very important and symbolic, since this line usually serves as a trend reference. The fact that the pair failed to consolidate above it indicates that the downward trend continues. Therefore, quotes may continue to fall this week. We would not count on macroeconomic statistics or "fundamentals" for help in this, since Bank of England Governor Andrew Bailey's speech is unlikely to have any impact on the market, and Friday is still far away. Accordingly, the pound retains high chances for continued depreciation against the US dollar, but it clearly needs a new impetus, which is not yet available. If the Nonfarm data turns out to be strong on Friday, this momentum can be obtained.
There were surprisingly many trading signals on Monday. And they did not turn out to be false and disappointing. First, the pair overcame and rebounded from the level of 1.2106 from above, so it was possible to open long positions. Then the price rose to the critical line and overcame it. But it couldn't move even higher, so at the first signal to sell, long positions should have been closed and short positions should have been opened. As a result, the profit was 15 points. We also managed to make some money on shorts, as the price dropped to the level of 1.2106 and even settled below it. But the movement ended there, so the deal had to be closed manually. Profit amounted to 35 points. In the end, it turned out to be a very good day.
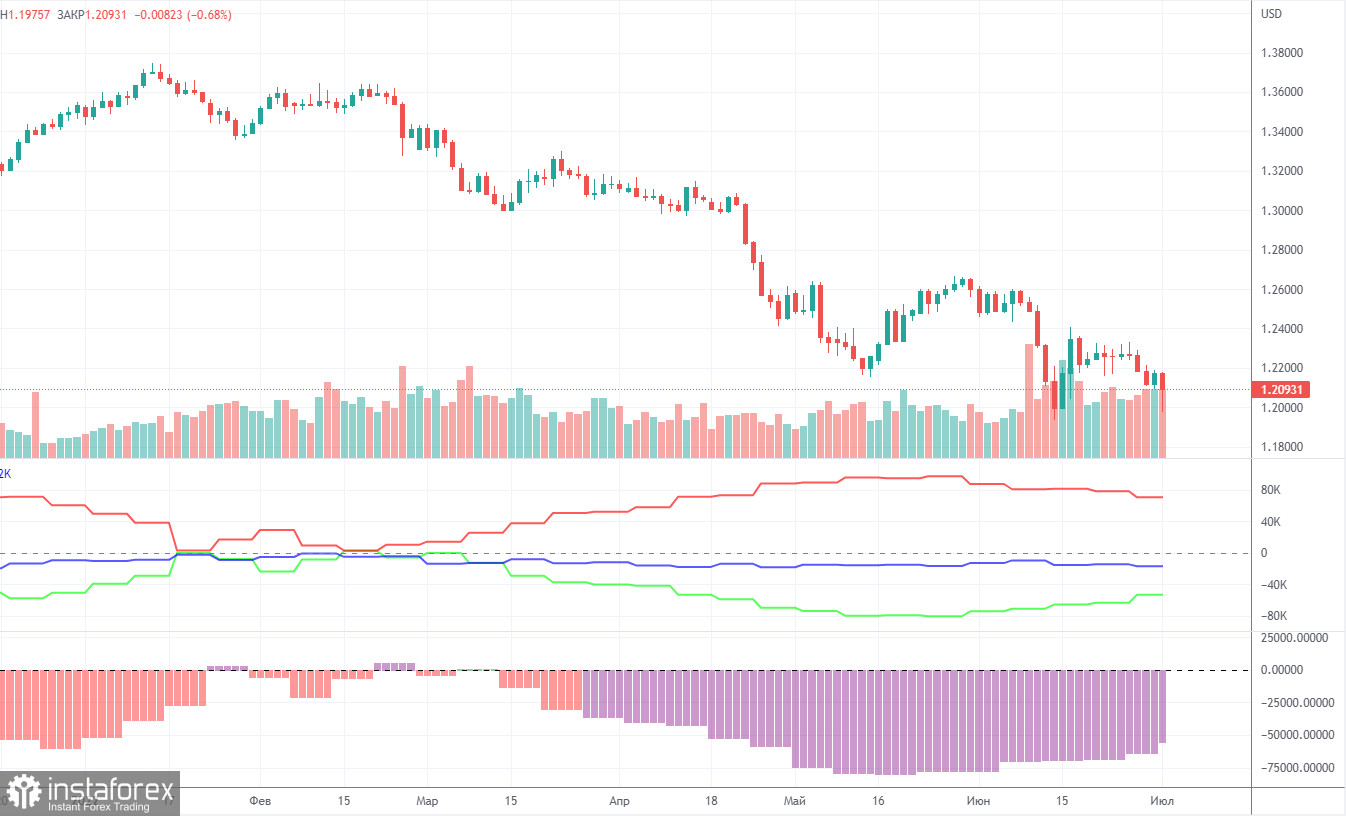
COT report:
The latest Commitment of Traders (COT) report again showed insignificant changes. During the week, the non-commercial group opened 6,700 long positions and closed 3,400 short positions. Thus, the net position of non-commercial traders increased by 10,000. However, the mood of major players still remains "pronounced bearish", which is clearly seen from the second indicator in the chart above. And the pound, despite the increase in the net position, still cannot show even a tangible upward correction. The net position has been falling for three months, now it is rising, but what difference does it make if the British currency is depreciating anyway? We have already said that the COT reports for the pound do not take into account the demand for the dollar, which is likely to remain very high right now. Consequently, even for the strengthening of the British currency, it is required that demand for it grows faster and stronger than demand for the dollar. The non-commercial group currently has a total of 88,000 short positions open and only 35,000 longs. The net position will have to show growth for a long time to at least equalize these figures. Neither macroeconomic statistics nor fundamental events support the UK currency. As before, we can only count on corrective growth, but we believe that the pound will continue to fall in the medium term.
We recommend to familiarize yourself with:
Overview of the EUR/USD pair. July 5. The euro is waiting for a miracle, but it is unlikely to wait.
Overview of the GBP/USD pair. July 5. Geopolitics continues to deteriorate, which is not a plus for the pound and the euro.
Forecast and trading signals for GBP/USD on July 5. Detailed analysis of the movement of the pair and trading transactions.
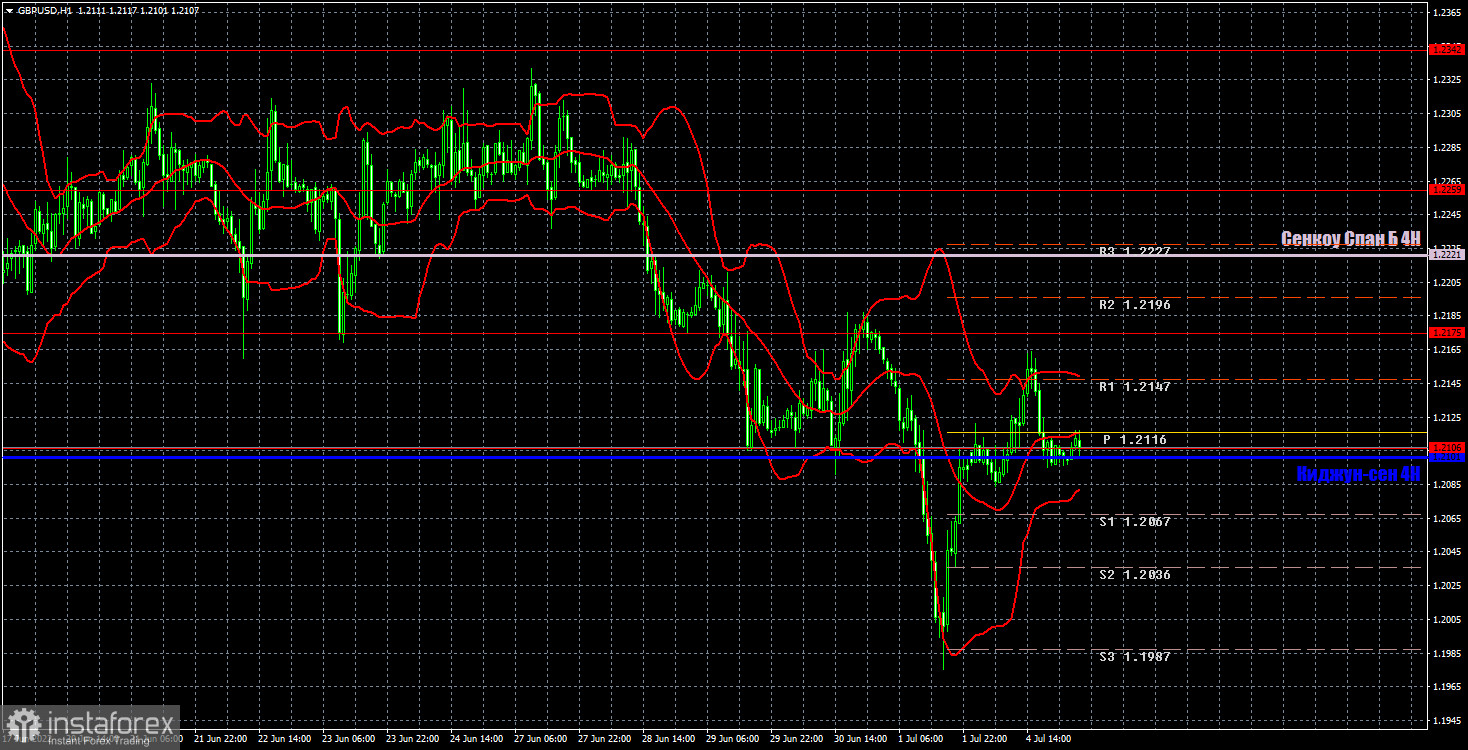
GBP/USD 1H
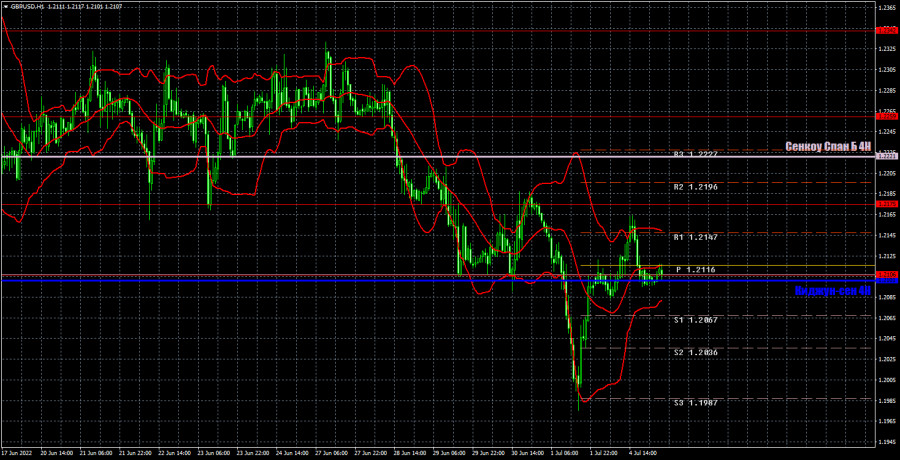
We can see on the hourly timeframe that the pair cannot return to the level of 1.1932 in any way, but still it is moving in its direction. Therefore, this level can be reached by this week. It is still very difficult for the pound to count on strong growth, as there are no grounds for this. We highlight the following important levels on July 5: 1.1932, 1.2106, 1.2175, 1.2259, 1.2342. Senkou Span B (1.2221) and Kijun-sen (1.2101) lines can also be sources of signals. Signals can be "rebounds" and "breakthroughs" of these levels and lines. The Stop Loss level is recommended to be set to breakeven when the price passes in the right direction by 20 points. Ichimoku indicator lines can move during the day, which should be taken into account when determining trading signals. The chart also contains support and resistance levels that can be used to take profits on trades. The UK is set to publish the index of business activity in the services sector in the second assessment for June. This report is unlikely to find its own reflection on the pair's chart. Bailey has more chances for a market reaction, but not much either. And nothing interesting to expect in the US.
Explanations for the chart:
Support and Resistance Levels are the levels that serve as targets when buying or selling the pair. You can place Take Profit near these levels.
Kijun-sen and Senkou Span B lines are lines of the Ichimoku indicator transferred to the hourly timeframe from the 4-hour one.
Support and resistance areas are areas from which the price has repeatedly rebounded off.
Yellow lines are trend lines, trend channels and any other technical patterns.
Indicator 1 on the COT charts is the size of the net position of each category of traders.
Indicator 2 on the COT charts is the size of the net position for the non-commercial group.