empty
13.04.2023 08:42 AM
Technical Analysis of ETH/USD for April 13, 2023

Crypto Industry News:

The Ethereum update, code-named Shanghai, took place on April 12. One of the main changes is allowing network validators to output their ETH. Many people wonder what will happen in such a situation in the short and medium term with the ETH price and the number of tokens staked. According to experts, we can expect (and note) slight fluctuations in the price of Ethereum and a temporary decrease in the number of active stakers, but over time, both the price and the sum of stakers should increase, for example from a change in the way the network works.

Compared to other leading Proof-of-Stake (PoS) chains, Ethereum falls short. The best PoS chains have around 45% of their native tokens in the staking freezer, with the only exception to this rule being Binance-owned BNB (15%, similar to Ethereum). This may be due to the fact that Binance users who hold BNB receive a 25% discount on trading fees, thus providing the token with additional utility not available on other Proof-of-Stake networks.

Given this information, it is highly likely that the amount of ETH stashed will increase in the coming weeks following the Shanghai fork. Retail holders who previously hesitated to deposit their assets for an indefinite period of time may now slowly start to do so more willingly. In addition, institutional investors who were previously unable to lock in their stakeholder capital in staking will now be able to monetize their ETH holdings, eliminating the previously existing risk.

In this context, according to analysts, the volume of stashed ETH could increase to 25%-30% within a year, making the Ethereum network more secure and reducing the amount of ETH supply available on the market.

Technical Market Outlook:

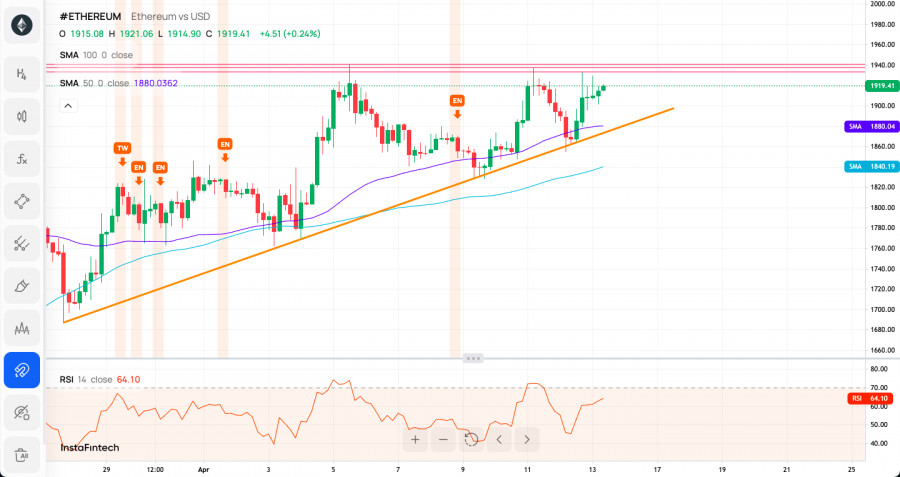
The Shanghai update is done and the ETH/USD pair has been seen testing the last swing high located at $1,940. In a case of a breakout higher, the next target for bulls is seen at the level of $2,000, but so far is more probable that a potential Double Top technical pattern was made around the last swing high. The strong and positive momentum on the H4 time frame chart support the short-term bullish outlook for Bitcoin, however, the market conditions coming off the extremely overbought levels. The level of $1,858, $1,845 and $1,832 will now act as the support for bulls, so please pay attention to this level during the local pull-back.

This image is no longer relevant

Weekly Pivot Points:

WR3 - $2,078

WR2 - $1,988

WR1 - $1,955

Weekly Pivot - $1,898

WS1 - $1,862

WS2 - $1,809

WS3 - $1,719

Trading Outlook:

The Ethereum market has been seen making lower highs and lower low since the swing high was made in the middle of the August 2022 at the level of $2,029. This is the key level for bulls, so it needs to be broken in order to continue the up trend. The key technical support is seen at $1,368, so as long as the market trades above this level, the outlook remains bullish.

Select timeframe
5
min
15
min
30
min
1
hour
4
hours
1
day
1
week
Earn on cryptocurrency rate changes with InstaForex
Download MetaTrader 4 and open your first trade
  • Grand Choice
    Contest by
    InstaForex
    InstaForex always strives to help you
    fulfill your biggest dreams.
    JOIN CONTEST

Recommended Stories

Bitcoin and Ethereum Regain Strength

Bitcoin and Ethereum are showing strong performance. After holding the $100,000 level, large buyers returned to their usual activity and have already pushed BTC back to the $105,000 area. Ethereum

Jakub Novak 10:52 2025-06-24 UTC+2

Trading Recommendations for the Cryptocurrency Market on June 24

Bitcoin and Ethereum surged sharply after news emerged that Iran and Israel might halt their exchanges of strikes. U.S. President Donald Trump announced yesterday that Iran and Israel had agreed

Miroslaw Bawulski 10:04 2025-06-24 UTC+2

Trading Recommendations for the Cryptocurrency Market on June 23

Bitcoin and Ethereum plummeted following speculation that Iran might block the Strait of Hormuz and begin bombing U.S. oil tankers in retaliation for American strikes. This triggered a massive sell-off

Miroslaw Bawulski 09:07 2025-06-23 UTC+2

Trading tips for crypto market on May 20 (North American session)

Bitcoin and Ether performed well today in terms of buying following a pause in yesterday's bear market. Demand has returned to the cryptocurrency market, especially after geopolitical tensions eased somewhat

Miroslaw Bawulski 16:20 2025-06-20 UTC+2

Trading Recommendations for the Cryptocurrency Market on June 20

Bitcoin continued trading within a sideways channel, dropping to the $104,000 area yesterday before recovering to a more acceptable level of $104,500. Ethereum also showed no clear directional movement. Despite

Miroslaw Bawulski 09:24 2025-06-20 UTC+2

Technical Analysis of Intraday Price Movement of Ripple Cryptocurrency, Friday June 20, 2025.

The Ripple cryptocurrency on its 4-hour chart appears to be moving in a ranging - sideways condition where it is currently stuck at the Support Bullish Rejection Block area level

Arief Makmur 07:45 2025-06-20 UTC+2

Technical Analysis of Intraday Price Movement of Doge Cryptocurrency, Friday June 20, 2025.

From what is seen on the 4-hour chart, the Doge cryptocurrency appears to be moving under a Bearish bias, where this can be seen from its price movement which

Arief Makmur 07:45 2025-06-20 UTC+2

BTC/USD Analysis on June 19, 2025

The wave pattern on the 4-hour BTC/USD chart has become more complex in recent months. A corrective downward structure formed and completed near the $75,000 level. After that, a fairly

Chin Zhao 11:07 2025-06-19 UTC+2

Trading Recommendations for the Cryptocurrency Market on June 19

Yesterday, Bitcoin and Ethereum remained under pressure, failing to receive support from major players despite attempts to break through key resistance levels. After dipping to around $130,400, Bitcoin is currently

Miroslaw Bawulski 08:36 2025-06-19 UTC+2

Wave analysis of BTC/USD on June 18. Bitcoin to clear up its overall impulse

The wave pattern on the 4-hour chart of BTC/USD has become more complicated in recent months. We observed a corrective downward structure that completed near the $75,000 mark. After that

Chin Zhao 15:34 2025-06-18 UTC+2
Can't speak right now?
Ask your question in the chat.
Widget callback
 

Dear visitor,

Your IP address shows that you are currently located in the USA. If you are a resident of the United States, you are prohibited from using the services of InstaFintech Group including online trading, online transfers, deposit/withdrawal of funds, etc.

If you think you are seeing this message by mistake and your location is not the US, kindly proceed to the website. Otherwise, you must leave the website in order to comply with government restrictions.

Why does your IP address show your location as the USA?

  • - you are using a VPN provided by a hosting company based in the United States;
  • - your IP does not have proper WHOIS records;
  • - an error occurred in the WHOIS geolocation database.

Please confirm whether you are a US resident or not by clicking the relevant button below. If you choose the wrong option, being a US resident, you will not be able to open an account with InstaForex anyway.

We are sorry for any inconvenience caused by this message.