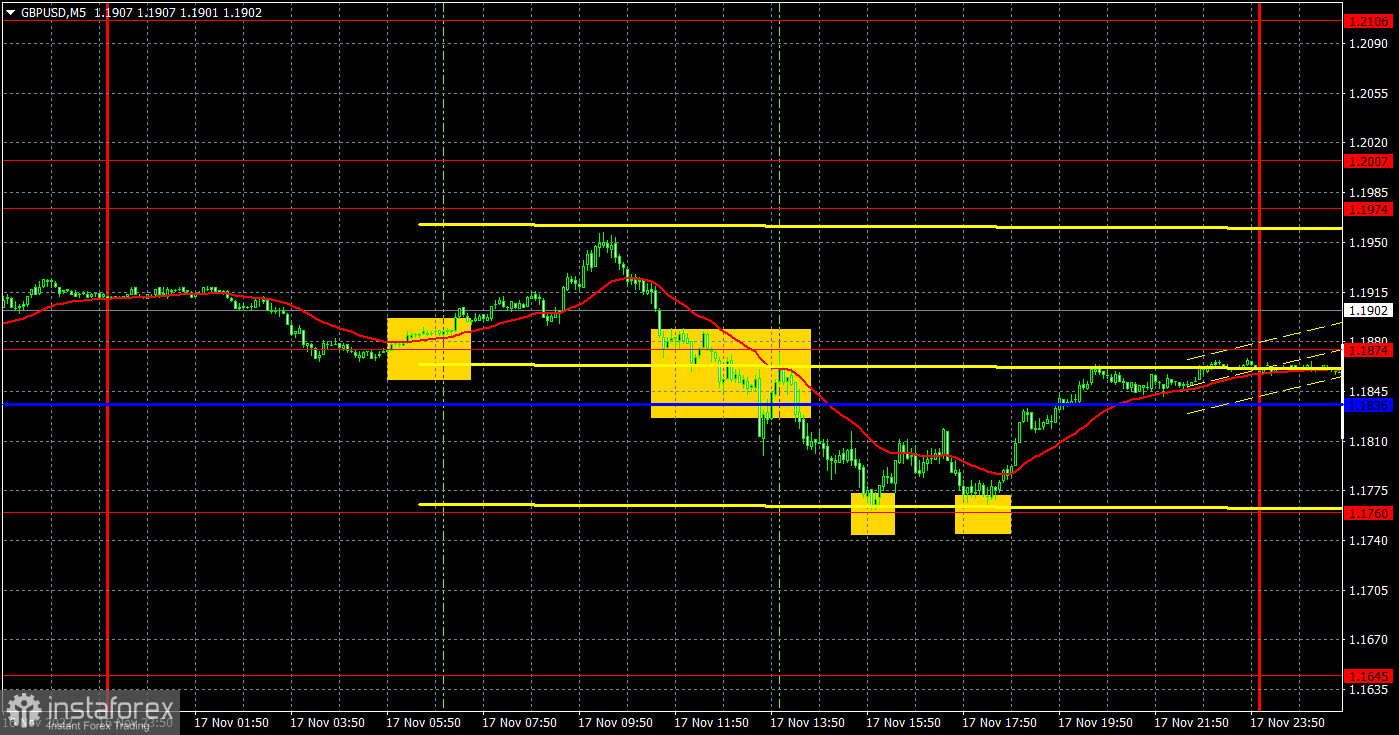
Analysis of GBP/USD, 5-minute chart
The GBP/USD currency pair showed two good movements on Thursday. The pair began a rather sharp fall in the middle of the European trading session, which, from our point of view, was provoked by the presentation of the budget plan for the next financial year by the UK Secretary of the Treasury Jeremy Hunt (which we wrote about in more detail in the fundamental review of the pound), but in the late afternoon there was already an upward movement and at the moment the pair has returned to its original positions. Therefore, formally, it corrected this week, as we expected, but the correction turned out to be very weak, we expected and still expect a stronger fall in quotes. There were no important reports and events of a macroeconomic nature in the UK yesterday. Reports on the construction market were published in the US, as well as on applications for benefits by the American population. Both reports rarely cause at least some market reaction. Therefore, we do not associate yesterday's movements with macroeconomics. The ascending trend line remains relevant, so from a technical point of view, further growth can be expected. And no fundamental and macroeconomic reports.
Trading signals on the 5-minute chart were not the best on Thursday, but still not as bad as the euro. First, the price bounced off the level of 1.1874 and went up 55 points. Therefore, there could not be a loss on a long position (Stop Loss at breakeven). Then the price formed a sell signal below the Kijun-sen line, after which it managed to reach the target level of 1.1760. Traders managed to get about 35 pips of profit on this trade. There were two rebounds from the level of 1.1760. After the first one, the price went up 40 points, but did not reach the critical line - Stop Loss at breakeven. The second rebound was formed too late, it should not have been worked out. As a result, the day ended with a small profit.
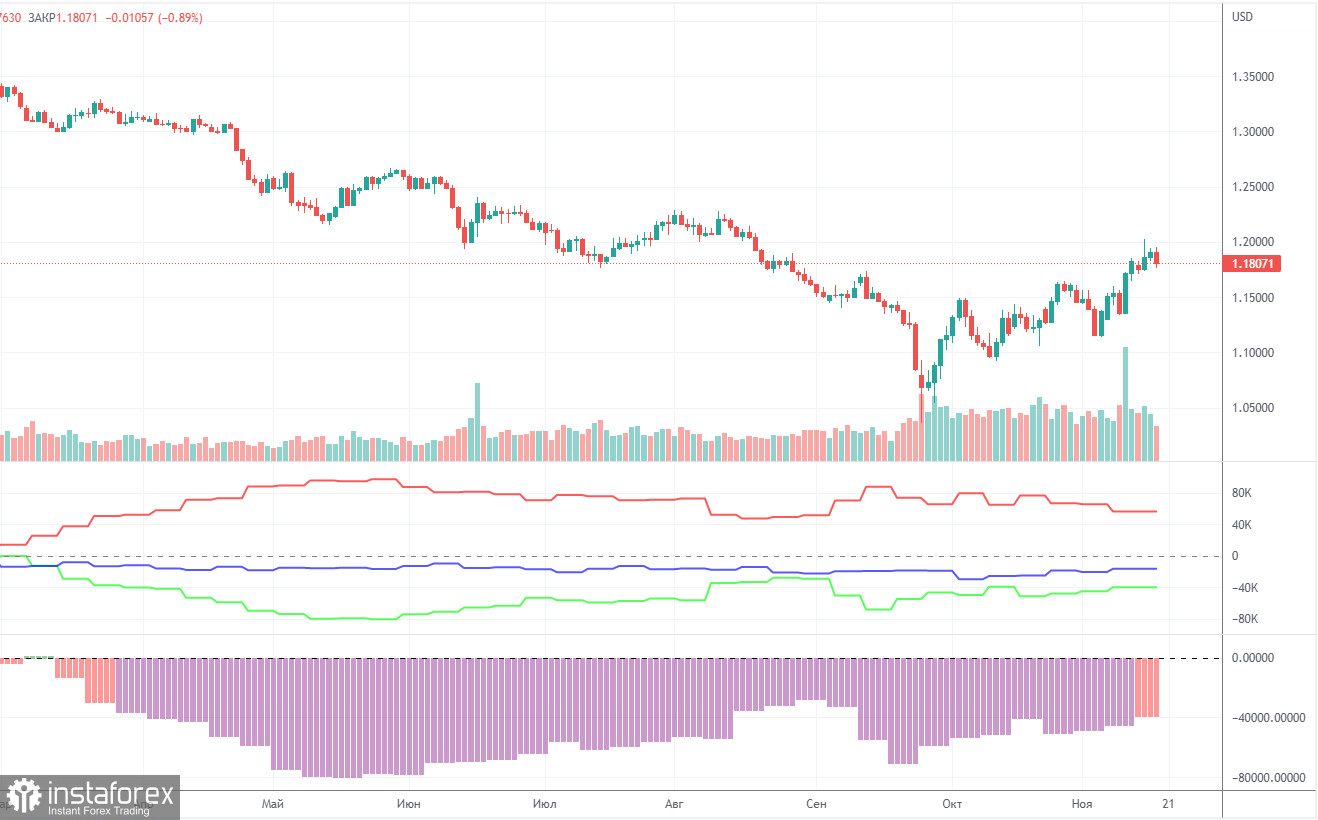
COT report
The latest Commitment of Traders (COT) report on the British pound showed a slight weakening of the bearish sentiment. In the given period, the non-commercial group closed 8,500 long positions and 11,500 short positions. Thus, the net position of non-commercial traders increased by 3,000, which is very small for the pound. The net position indicator has been slowly rising in recent weeks, but this is not the first time it has risen, but the mood of the big players remains "pronounced bearish" and the pound remains on a downward trend in the medium term. And, if we recall the situation with the euro, then there are big doubts that based on the COT reports, we can expect a strong growth from the pair. How can you count on it if the market buys the dollar more than the pound?
The non-commercial group has now opened a total of 79,000 shorts and 34,000 longs. The difference, as we can see, is still very big. The euro cannot rise even though major players are bullish, and the pound will suddenly be able to grow in a bearish mood? As for the total number of open longs and shorts, here the bulls have an advantage of 21,000. But, as we can see, this indicator also does not help the pound too much. We remain skeptical about the long-term growth of the British currency, although there are certain technical reasons for this.
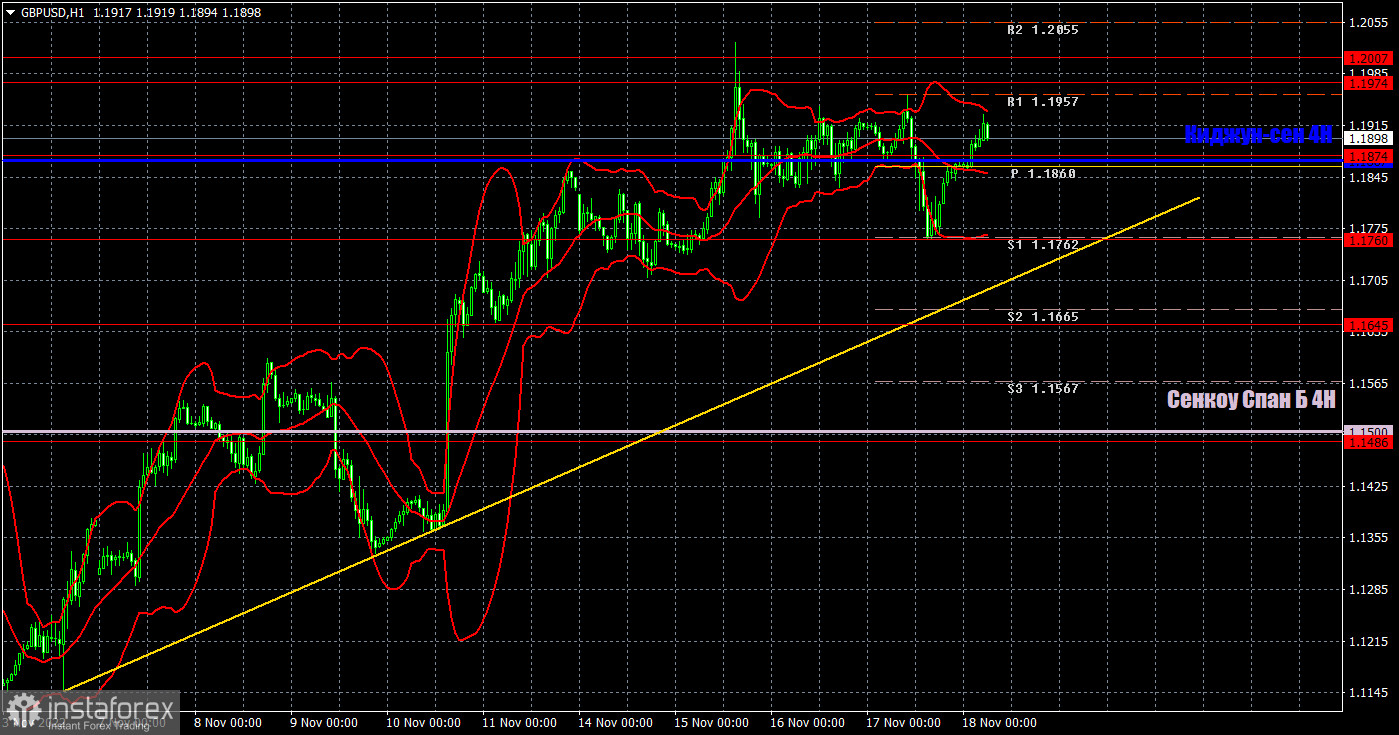
Analysis of GBP/USD, 1-hour chart
The pound/dollar pair began a long-awaited, but so far very weak, correction on the one-hour chart. We consider the pound's growth in recent weeks somewhat unfounded, and this week the pound began to correct only on Thursday. However, we expect it to continue falling.
On Friday, the pair may trade at the following levels: 1.1486, 1.1645, 1.1760, 1.1874, 1.1974-1.2007, 1.2106, 1.2185, 1.2259. The Senkou Span B (1.1500) and Kijun-sen (1.1867) lines can also give signals if the price rebounds or breaks these levels. The Stop Loss level is recommended to be set to breakeven when the price passes in the right direction by 20 points. The lines of the Ichimoku indicator may move during the day, which should be taken into account when determining trading signals. Also, there are support and resistance levels that can be used to lock in profits.
The UK will publish a report on retail sales, which is far from the most important, and the calendar is empty in the US. Thus, we do not expect a strong market reaction today. Most likely, it will again trade on technique.
What we see on the trading charts:
Price levels of support and resistance are thick red lines, near which the movement may end. They do not provide trading signals.
The Kijun-sen and Senkou Span B lines are the lines of the Ichimoku indicator, moved to the one-hour chart from the 4-hour one. They are strong lines.
Extreme levels are thin red lines from which the price bounced earlier. They provide trading signals.
Yellow lines are trend lines, trend channels, and any other technical patterns.
Indicator 1 on the COT charts reflects the net position size of each category of traders.
Indicator 2 on the COT charts reflects the net position size for the non-commercial group.