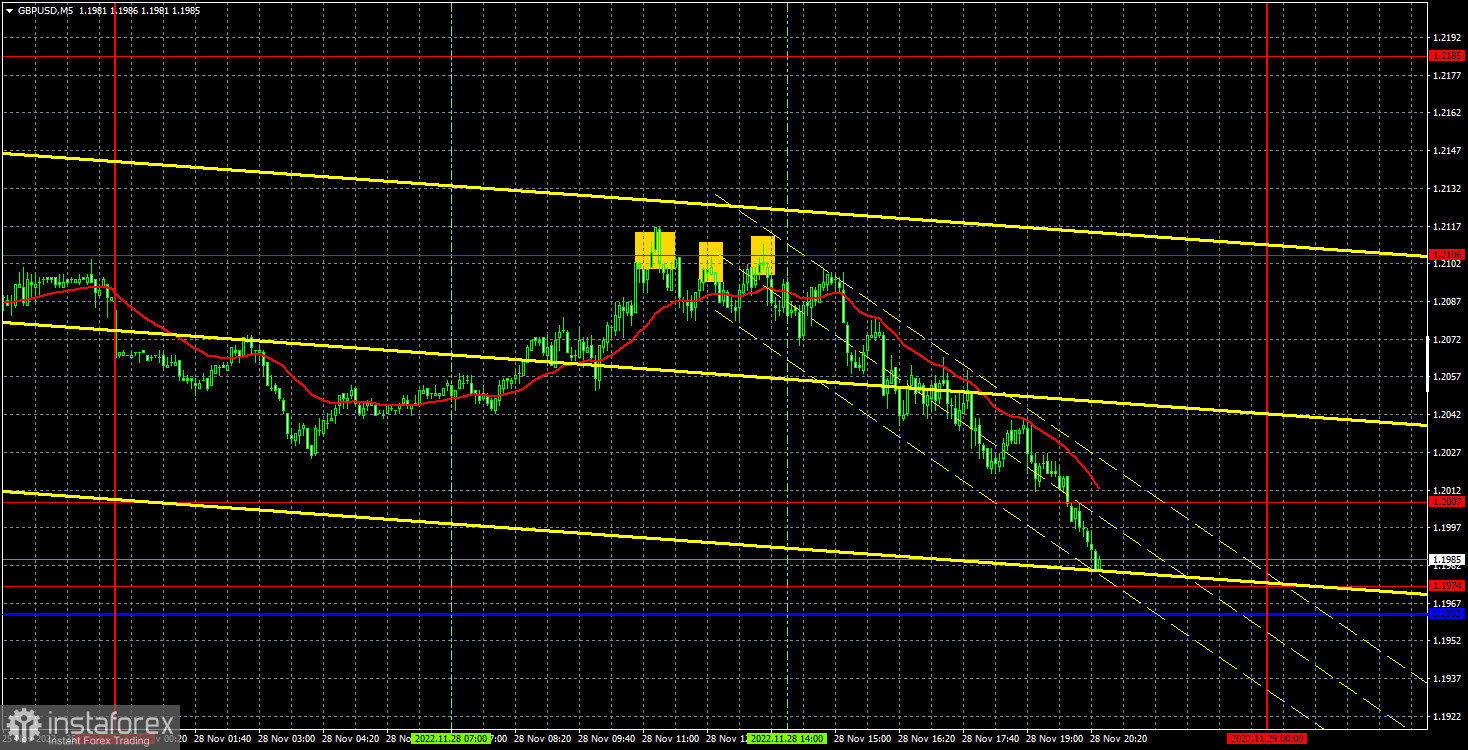
empty
29.11.2022 07:14 AM
Outlook and trading signals for GBP/USD on November 29. COT report. Analysis of market situation. The British pound is finally starting a downward correction

M5 chart of GBP/USD

This image is no longer relevant

The GBP/USD also showed a strong downward movement on Monday afternoon. However, the pound's movement was different from that of the euro, which initially rose strongly. However, by the end of the day it became clear that the pairs are still synchronized, so we expect a bearish correction from both of them. In the pound's case, an important event happened yesterday - the price settled below the ascending trend line, and it may also cross the Kijun-Sen line. If that happens, then traders can use two strong sell signals. In this case, the pound might fall by 300-400 pips, as its growth in recent weeks requires at least a purely technical correction. We are already silent about the fact that the British currency was not always growing in a logical or reasonable manner.

As for trading signals, the pound's situation was not as bright as it was for the euro. There were three consecutive sell signals near the level of 1.2106, and as we recall, if the first two signals are false, then it is better not to use all the next ones. However, yesterday we were lucky with the signals, because the price did not go down the required 20 pips even after the first and second signal, which means that the first short position was the only one that shouldn't have been closed. As a result, the pound dropped to the level of 1.2007 till the evening, and continued falling. The position should have been closed somewhere in this area. The profit on it was at least 80 points.
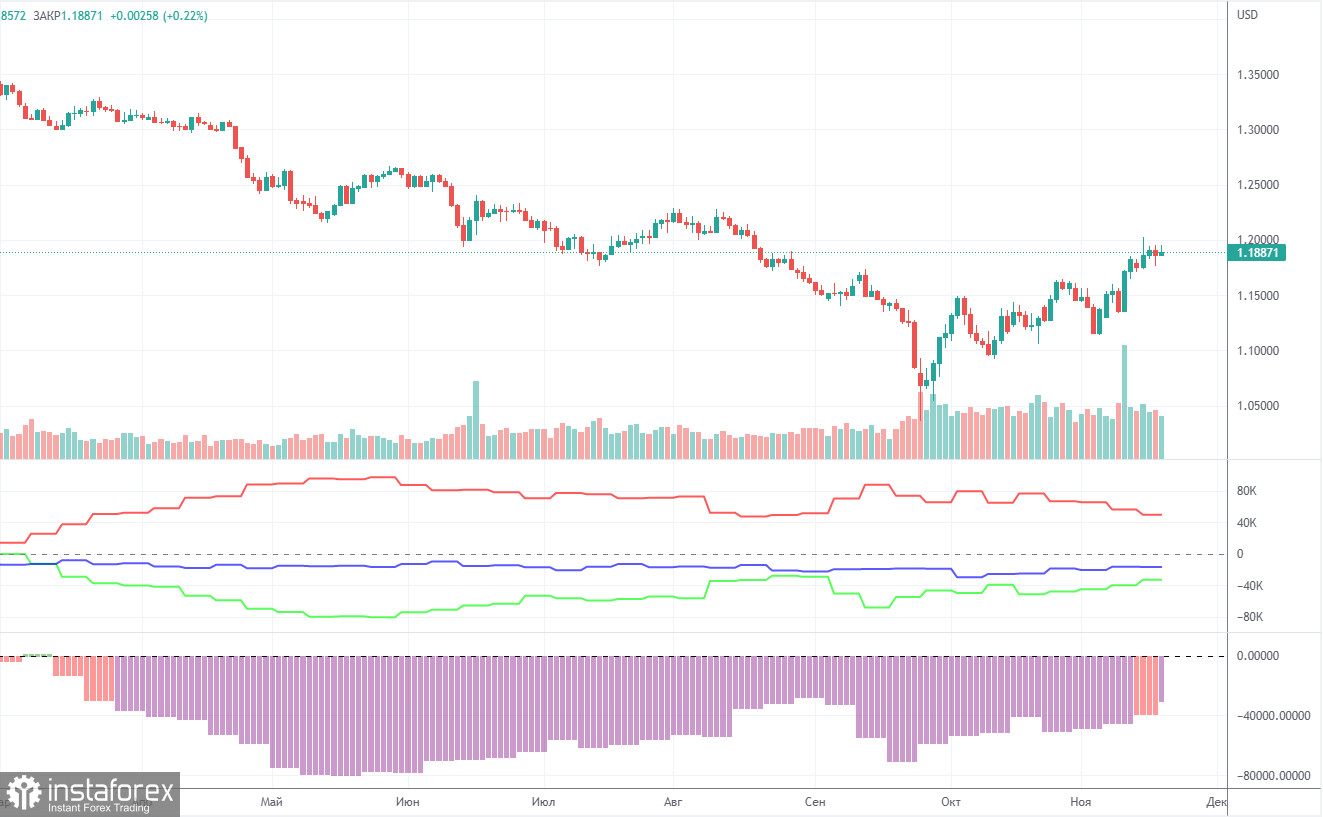
COT report

This image is no longer relevant

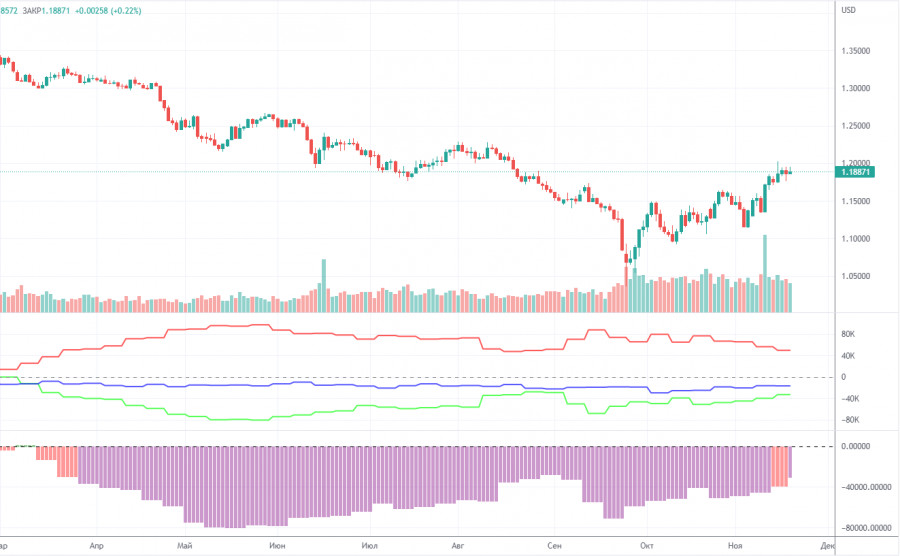
The latest Commitment of Traders (COT) report on GBP logged a slight decrease in bearish sentiment. In the given period, the non-commercial group closed 1,900 long positions and 8,800 short positions. Thus, the net position of non-commercial traders increased by 7,000. The net position is gradually growing during the last months, but the sentiment of the big players is still bearish. The pound has been rising in recent weeks, but so far it does not seem that it is preparing for a long-term uptrend. And, if we remember the euro's situation, then based on the COT reports, we can hardly expect a surge in price. The demand for the US currency remains very high, and the market, as it seems, is just waiting for new geopolitical shocks so it can return to buying the dollar. The non-commercial group now has a total of 67,000 shorts and 34,000 longs opened. As we can see, there is a wide gap between them. As it turns out the euro is now unable to show growth when market sentiment is bullish. When it comes to the total number of long and short positions, here bulls have an advantage of 17,000. Still, this is not enough for the sterling to increase. Anyway, we are still skeptical about the pound's long-term growth although the technical picture shows otherwise.
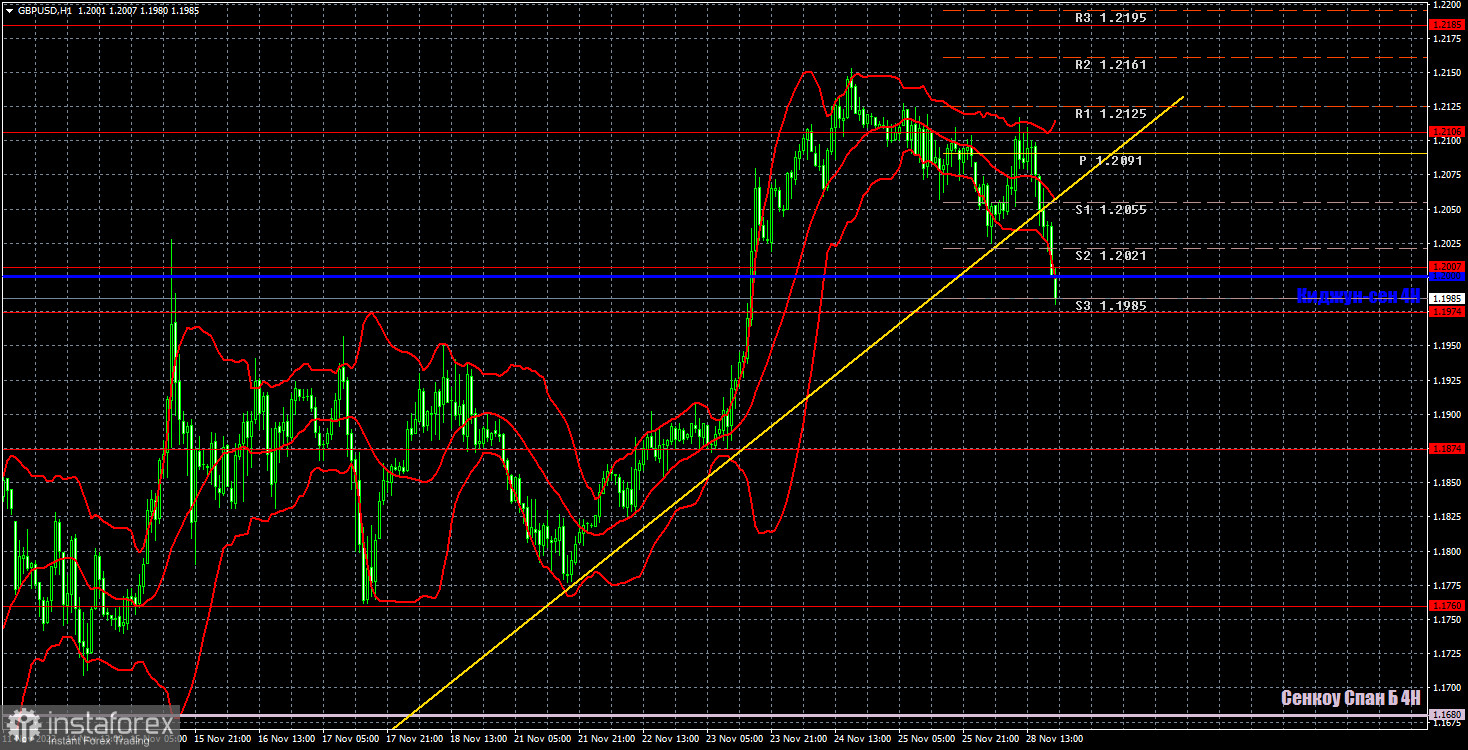
H1 chart of GBP/USD

This image is no longer relevant

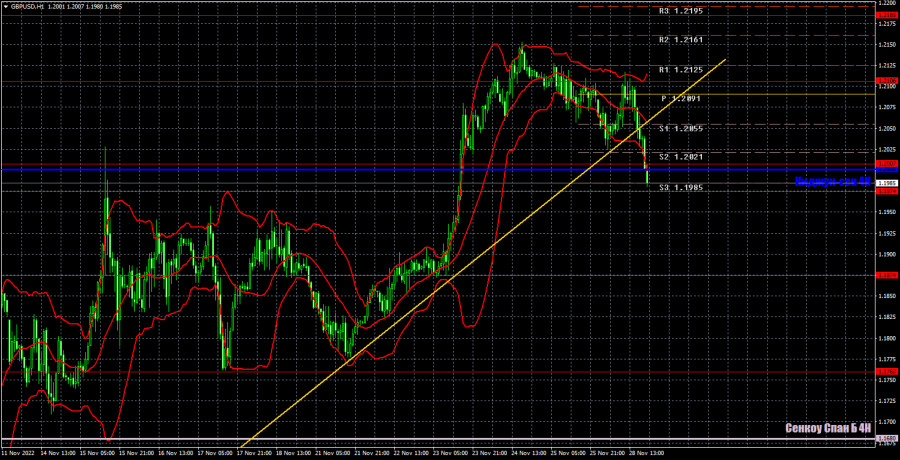
The pair started moving down, which we have been waiting for. It has crossed the trend line, so the uptrend is officially canceled. I believe that the pound may show a solid decline in the near future. On Tuesday, the pair may trade at the following levels: 1.1760, 1.1874, 1.1974-1.2007, 1.,2106, 1.2185, 1.2259, 1.2342. The Senkou Span B (1.1680) and Kijun Sen (1.2000) lines may also generate signals. Pullbacks and breakouts through these lines may produce signals as well. A Stop Loss order should be set at the breakeven point after the price passes 20 pips in the right direction. Ichimoku indicator lines may move during the day, which should be taken into account when determining trading signals. In addition, the chart does illustrate support and resistance levels, which could be used to lock in profits. There are no important events or reports in the UK and the USA. Therefore, traders will have nothing to react to. The pair can continue to correct and the movement may not be strong, as all the most important events are scheduled for the second half of the week.

What we see on the trading charts:

Price levels of support and resistance are thick red lines, near which the movement may end. They do not provide trading signals.

The Kijun-sen and Senkou Span B lines are the lines of the Ichimoku indicator, moved to the one-hour chart from the 4-hour one. They are strong lines.

Extreme levels are thin red lines from which the price bounced earlier. They provide trading signals.

Yellow lines are trend lines, trend channels, and any other technical patterns.

Indicator 1 on the COT charts reflects the net position size of each category of traders.

Indicator 2 on the COT charts reflects the net position size for the non-commercial group.

Paolo Greco,
Analytical expert of InstaForex
© 2007-2025
Summary
Urgency
Analytic
Stanislav Polyanskiy
Start trade
Earn on cryptocurrency rate changes with InstaForex
Download MetaTrader 4 and open your first trade
  • Grand Choice
    Contest by
    InstaForex
    InstaForex always strives to help you
    fulfill your biggest dreams.
    JOIN CONTEST

Recommended Stories

How to Trade GBP/USD on July 11h? Simple Tips and Trade Analysis for Beginners

Thursday Trade Review: GBP/USD, 1H Chart On Thursday, the GBP/USD pair continued its downward movement, mirroring the EUR/USD pair. The behavior of these two major currency pairs was nearly identical

Paolo Greco 08:43 2025-07-11 UTC+2

How to Trade EUR/USD on July 11th? Simple Tips and Trade Review for Beginners

On Thursday, the EUR/USD currency pair continued its weak downward movement in line with the current trend. We've been saying the same thing all week because very little is changing

Paolo Greco 08:36 2025-07-11 UTC+2

GBP/USD Trading Recommendations and Trade Review for July 11th

On Thursday, the GBP/USD currency pair continued its moderate decline. Over the past two weeks, the British pound has depreciated by 220 points, with approximately 150 of those losses occurring

Paolo Greco 08:30 2025-07-11 UTC+2

EUR/USD Trading Recommendations and Trade Review for July 11th

EUR/USD 5M Analysis On Thursday, the EUR/USD currency pair continued its sluggish decline, completely ignoring the fundamental backdrop. As a reminder, this week Donald Trump announced new tariffs targeting both

Paolo Greco 08:19 2025-07-11 UTC+2

How to Trade the GBP/USD Currency Pair on July 10th: Simple Tips and Trade Analysis for Beginners

Wednesday Trade Analysis: GBP/USD – 1H Chart On Wednesday, the GBP/USD pair was also stuck in a flat movement, with very low volatility. There were virtually no price movements during

Paolo Greco 08:56 2025-07-10 UTC+2

How to Trade the EUR/USD Currency Pair on July 10th: Simple Tips and Trade Analysis for Beginners

Wednesday Trade Analysis: EUR/USD – 1H Chart On Wednesday, the EUR/USD pair continued to trade in line with the prevailing trend from the previous week. Market activity was minimal throughout

Paolo Greco 08:48 2025-07-10 UTC+2

Trading Recommendations and Trade Review for GBP/USD on July 10th

On Wednesday, GBP/USD remained within its descending channel. However, a more interesting setup emerged in the 4-hour time frame, where the price attempted several times to break through the Senkou

Paolo Greco 06:57 2025-07-10 UTC+2

Trading Recommendations and Trade Review for EUR/USD on July 10th

On Wednesday, the EUR/USD pair continued moving within a weak downward channel, as previously forecast. However, volatility dropped to a minimum, there was no macroeconomic backdrop for the third consecutive

Paolo Greco 06:45 2025-07-10 UTC+2

How to Trade the GBP/USD Currency Pair on July 9th: Simple Tips and Trade Analysis for Beginners

On Tuesday, the GBP/USD pair continued its moderate downward movement, which is clearly of a technical and corrective nature. On both Monday and Tuesday, there were no significant macroeconomic events

Paolo Greco 08:46 2025-07-09 UTC+2

How to Trade the EUR/USD Currency Pair on July 9th? Simple Tips and Trade Breakdown for Beginners

On Tuesday, the EUR/USD currency pair continued its mild downward movement in line with the prevailing trend. After a fairly strong upward move, the market began a correction. The nature

Paolo Greco 08:28 2025-07-09 UTC+2
Can't speak right now?
Ask your question in the chat.
Widget callback
 

Dear visitor,

Your IP address shows that you are currently located in the USA. If you are a resident of the United States, you are prohibited from using the services of InstaFintech Group including online trading, online transfers, deposit/withdrawal of funds, etc.

If you think you are seeing this message by mistake and your location is not the US, kindly proceed to the website. Otherwise, you must leave the website in order to comply with government restrictions.

Why does your IP address show your location as the USA?

  • - you are using a VPN provided by a hosting company based in the United States;
  • - your IP does not have proper WHOIS records;
  • - an error occurred in the WHOIS geolocation database.

Please confirm whether you are a US resident or not by clicking the relevant button below. If you choose the wrong option, being a US resident, you will not be able to open an account with InstaForex anyway.

We are sorry for any inconvenience caused by this message.