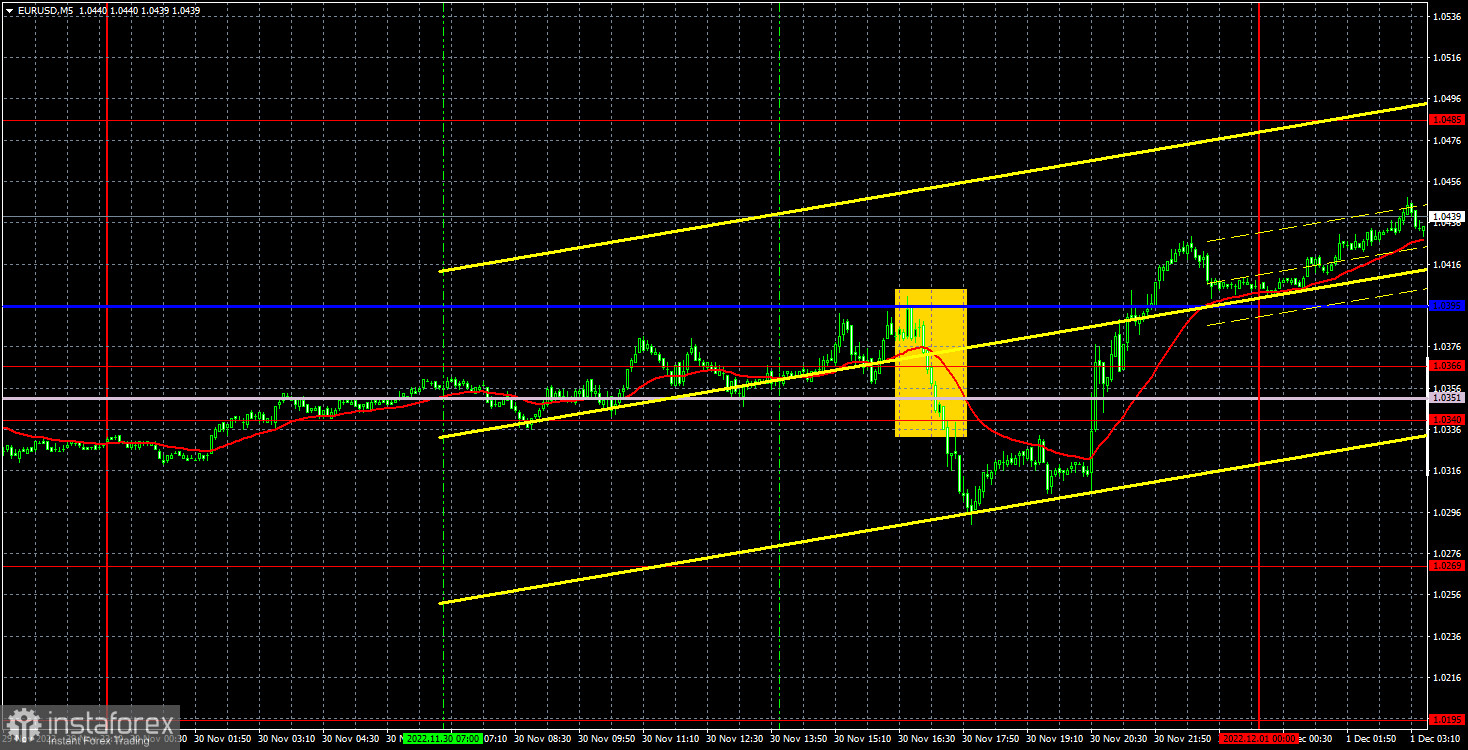
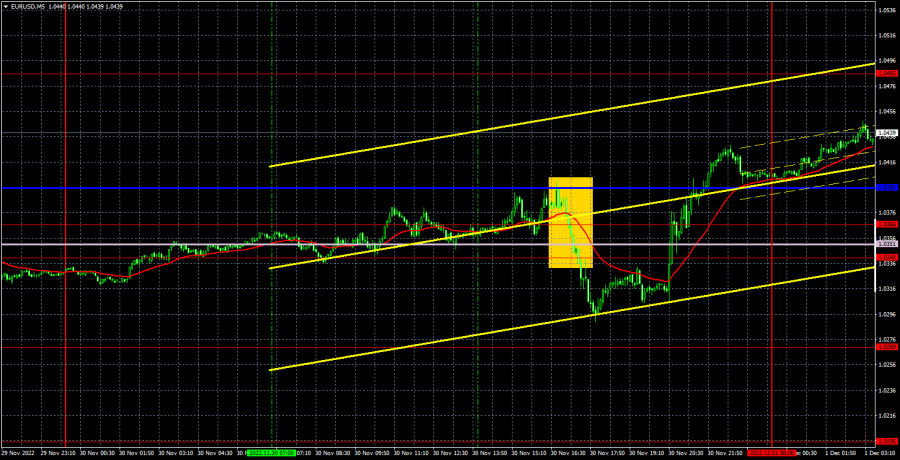
M5 chart of EUR/USD
Yesterday, the euro/dollar pair showed quite strange movements. There were quite a lot of macroeconomic statistics and fundamental events on Wednesday, nevertheless most of them were ignored. For example, there was quite an important report on European inflation, which surprisingly fell by 0.6% y/y. However, traders didn't think it was necessary to pay attention to this report. There were also important data on GDP in the third quarter and the ADP labor market during the US trading session. Here we can understand why traders did not react to it since it was contradictory: one report was very strong, the other was very weak. However, in a couple of hours after their release, the U.S. dollar began to rise sharply, and in another couple of hours - fell sharply. Everything would be fine if there were grounds for the final fall of the US currency in the form of Federal Reserve Chairman Jerome Powell's dovish rhetoric. But he just repeated the theses that everyone already knows. However, this time traders found some kind of "truth" in his speech that was not found in previous reports.
There was only one trading signal yesterday. The pair broke out of the 1.0395-1.0340 area in the middle of the US trading session, which could be used to open short positions. However, the price managed to go down only 30 pips, which was enough for the Stop Loss to breakeven, but no more.
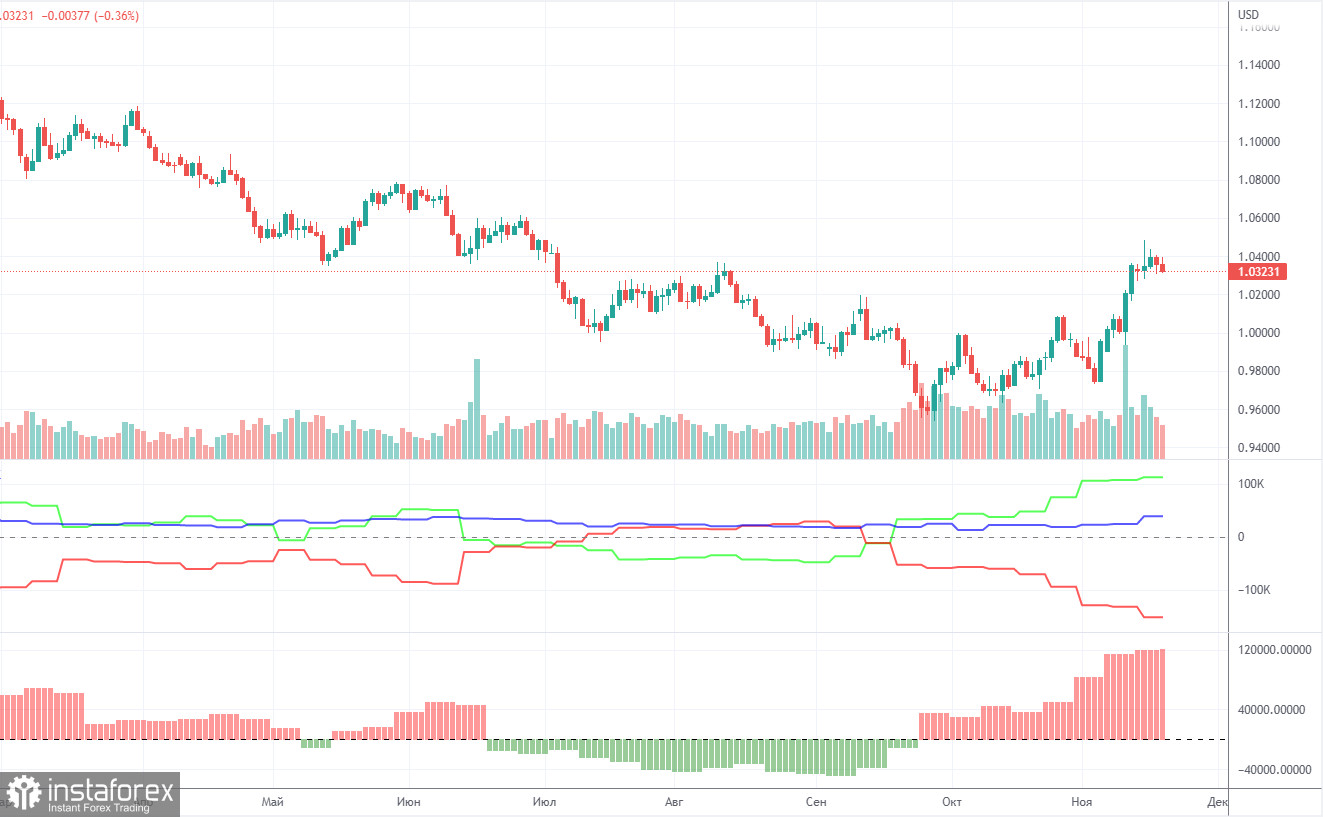
COT report
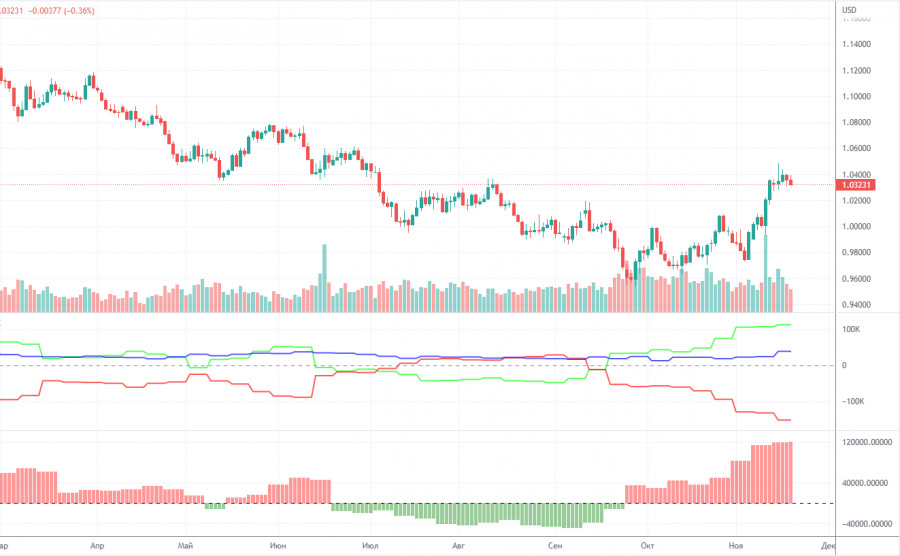
As for Commitment of Traders (COT) reports in 2022, they reflected bullish sentiment in the first six months of the year although the euro was bearish. Then, they illustrated bearish sentiment for several months with the euro being also bearish. Currently, the net position of non-commercial traders is again bullish and increasing. Meanwhile, the euro has hardly retreated from its 20-year lows. This is due to the fact that demand for the greenback is high amid a difficult geopolitical situation in the world. Therefore, despite a rise in demand for the euro, buoyant demand for the dollar does not allow the euro to strengthen. During the reporting week, the number of long positions held by non-commercial traders rose by 7,000 and that of short positions increased by 2,000. Consequently, the net position advanced by 5,000. The euro's recent growth is gradually coming in line with the figures illustrated in the COT report. Still, the greenback may resume growth under the influence of geopolitical factors or the lack of factors for further strengthening in the euro. The green and red lines of the first indicator moved far away from each other, which may indicate the end of the uptrend. The number of long positions exceeds that of short positions by 113,000. Therefore, the net position of non-commercial traders may continue to rise further, but without triggering a similar rise in the euro. When it comes to the total number of longs and shorts across all categories of traders, there are now 39,000 more short positions (635,000 vs 596,000).
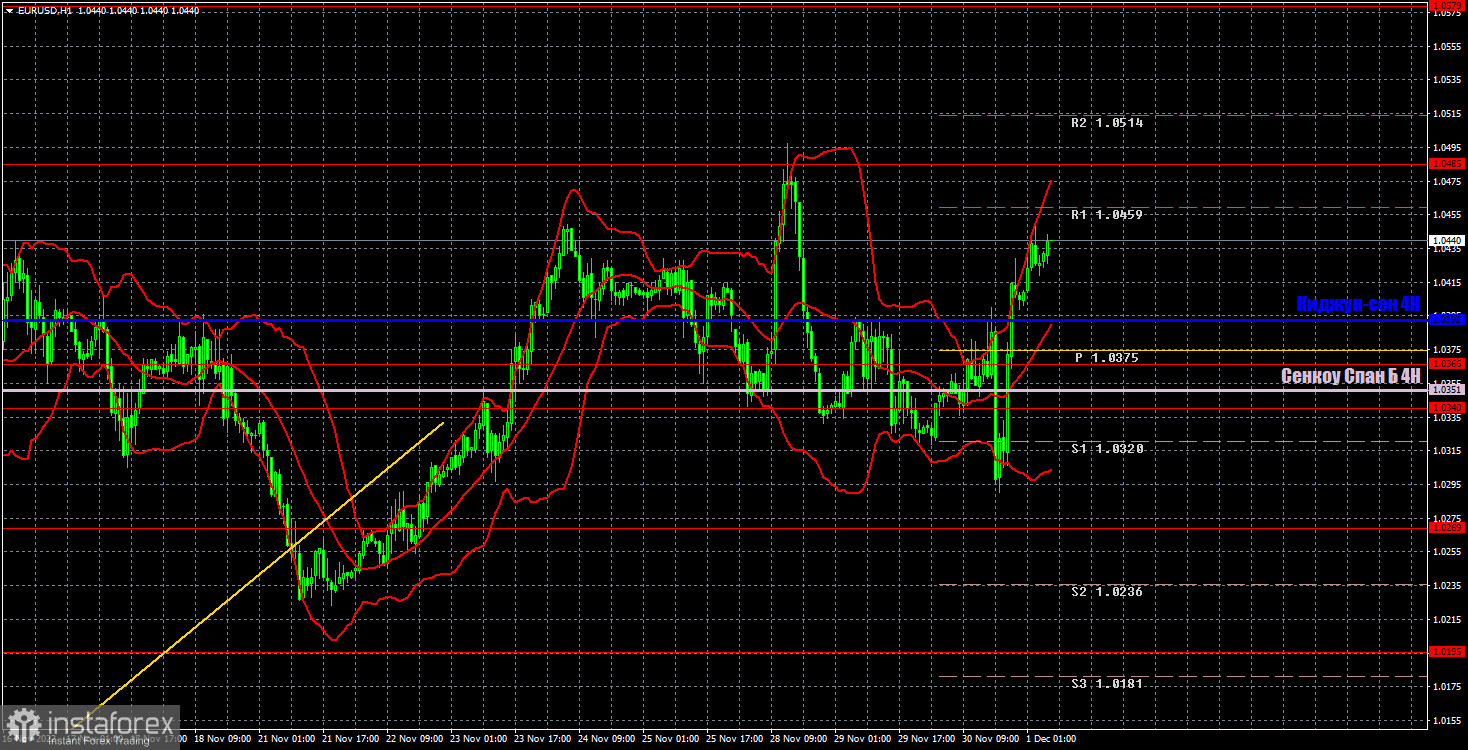
H1 chart of EUR/USD
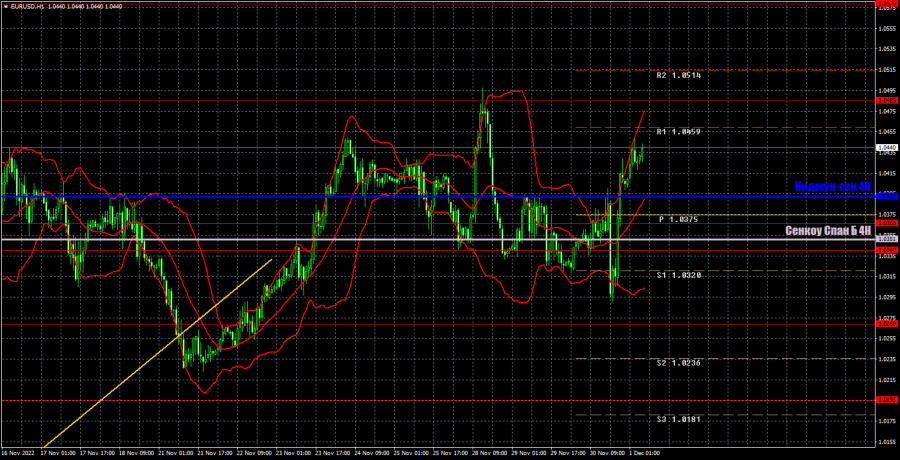
On the one-hour chart, EUR/USD is still showing completely inadequate movements and yesterday was just another proof of that. There is still no downward movement even after the euro crossed the ascending trend line. The pair returned to its local peaks after Powell's speech, but we still don't think that the EUR has any reasons for further growth. On Thursday, the pair may trade at the following levels: 1.0124, 1.0195, 1.0269, 1.0340-1.0366, 1.0485, 1.0579, 1.0637, and also Senkou Span B lines (1.0351) and Kijun Sen (1.0392). Lines of the Ichimoku indicator may move during the day, which should be taken into account when determining trading signals. There are also support and resistance levels, but signals are not formed near these levels. Bounces and breakouts of the extreme levels and lines could act as signals. Don't forget about stop-loss orders, if the price covers 15 pips in the right direction. This will prevent you from losses in case of a false signal. On December 1, the EU will publish unemployment data and the manufacturing activity index. Meanwhile, important ISM business activity indexes and reports on changes in personal income and expenditures of the American population will be released in the US. I believe that traders might react to the ISM data.
What we see on the trading charts:
Price levels of support and resistance are thick red lines, near which the movement may end. They do not provide trading signals.
The Kijun-sen and Senkou Span B lines are the lines of the Ichimoku indicator, moved to the one-hour chart from the 4-hour one. They are strong lines.
Extreme levels are thin red lines from which the price bounced earlier. They provide trading signals.
Yellow lines are trend lines, trend channels, and any other technical patterns.
Indicator 1 on the COT charts reflects the net position size of each category of traders.
Indicator 2 on the COT charts reflects the net position size for the non-commercial group.