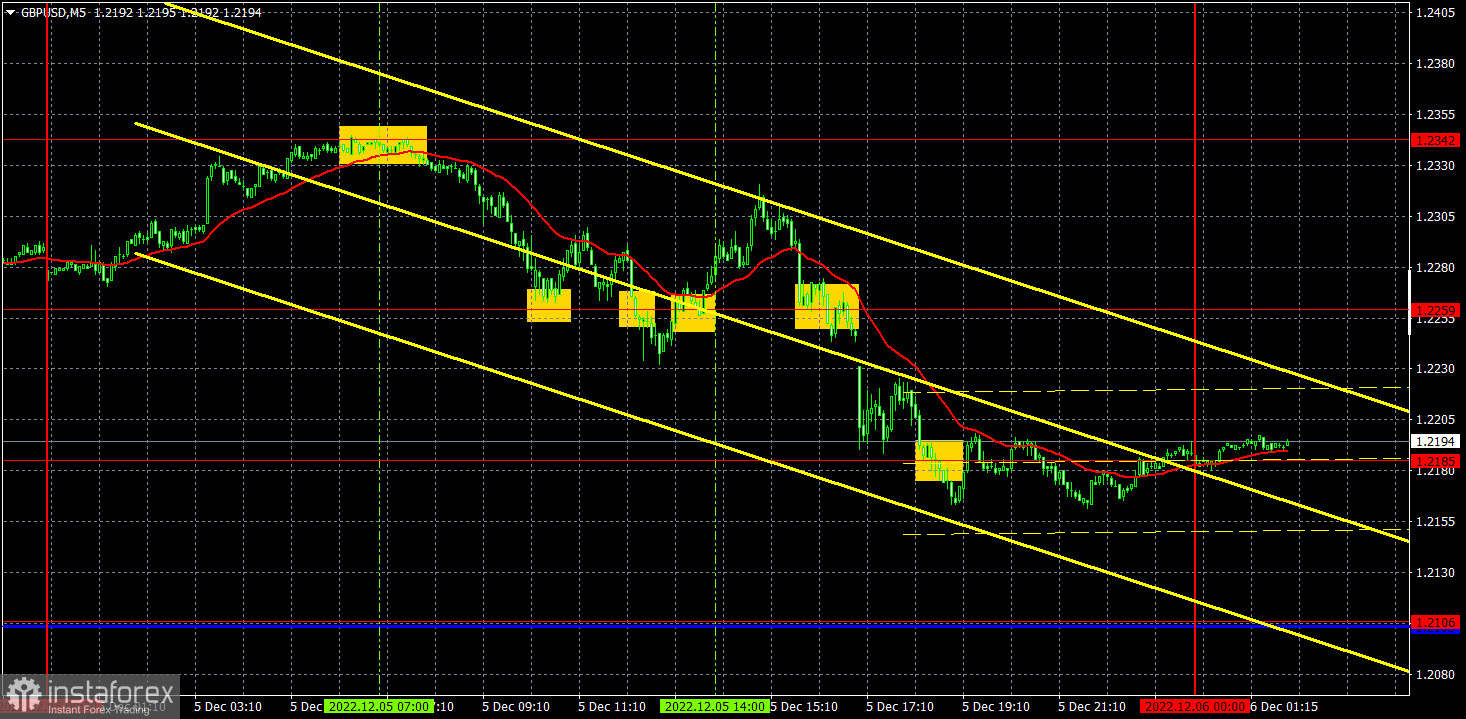
M5 chart of GBP/USD
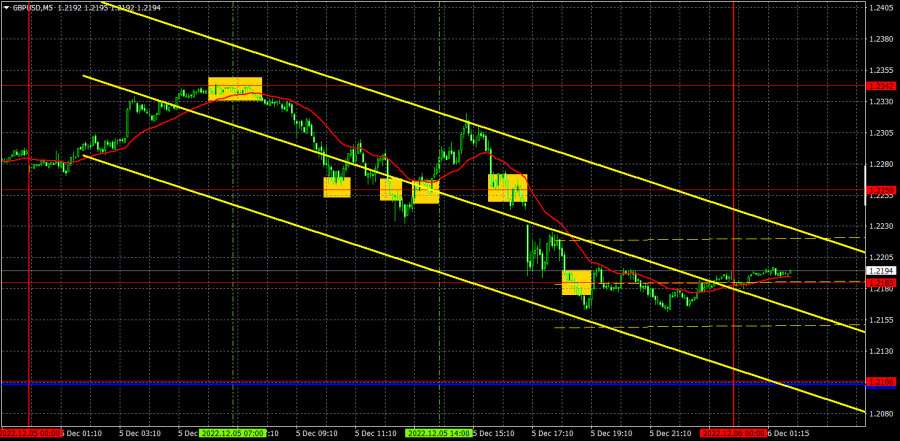
GBP/USD was also trading lower on Monday, but this is on the one-hour chart. For example, on the 4-hour chart, all of Monday's decline appears like a slight pullback. That is why this fall does not look like the correction that I have been waiting for. As it often happens lately, the most active movements happen during the US trading session. That is when the U.S. dollar showed the biggest growth, and this time it was supported by macroeconomic statistics, especially by the ISM U.S. service sector activity report. Traders finally worked off the report, which was in favor of the dollar, instead of ignoring it. But at the same time, it is too early to make conclusions. The pair might resume its unsubstantiated rally today, like it did on Friday after the initial reaction to the NonFarm report. That is why I keep waiting for a strong bearish correction, but the pair should cross the Senkou Span B and the Kijun-Sen lines in order for it to have some technical reason. Also, I believe that the dollar is oversold and the pound is overbought anyway.
Monday's trading signals were not the best. The first one was not bad (near 1.2342), after it was formed, the price went down to 1.2259 and rebounded from it with perfect accuracy. Therefore, traders had to close the shorts with about 50 pips profit. Then, four signals followed at once near 1.2259, and the first three turned out to be false. If at the first signal it was possible to set the Stop Loss to Breakeven, at the second one - you couldn't, and the third one should not have been used. As well as the most recent sell signal near 1.2185, which was formed too late.
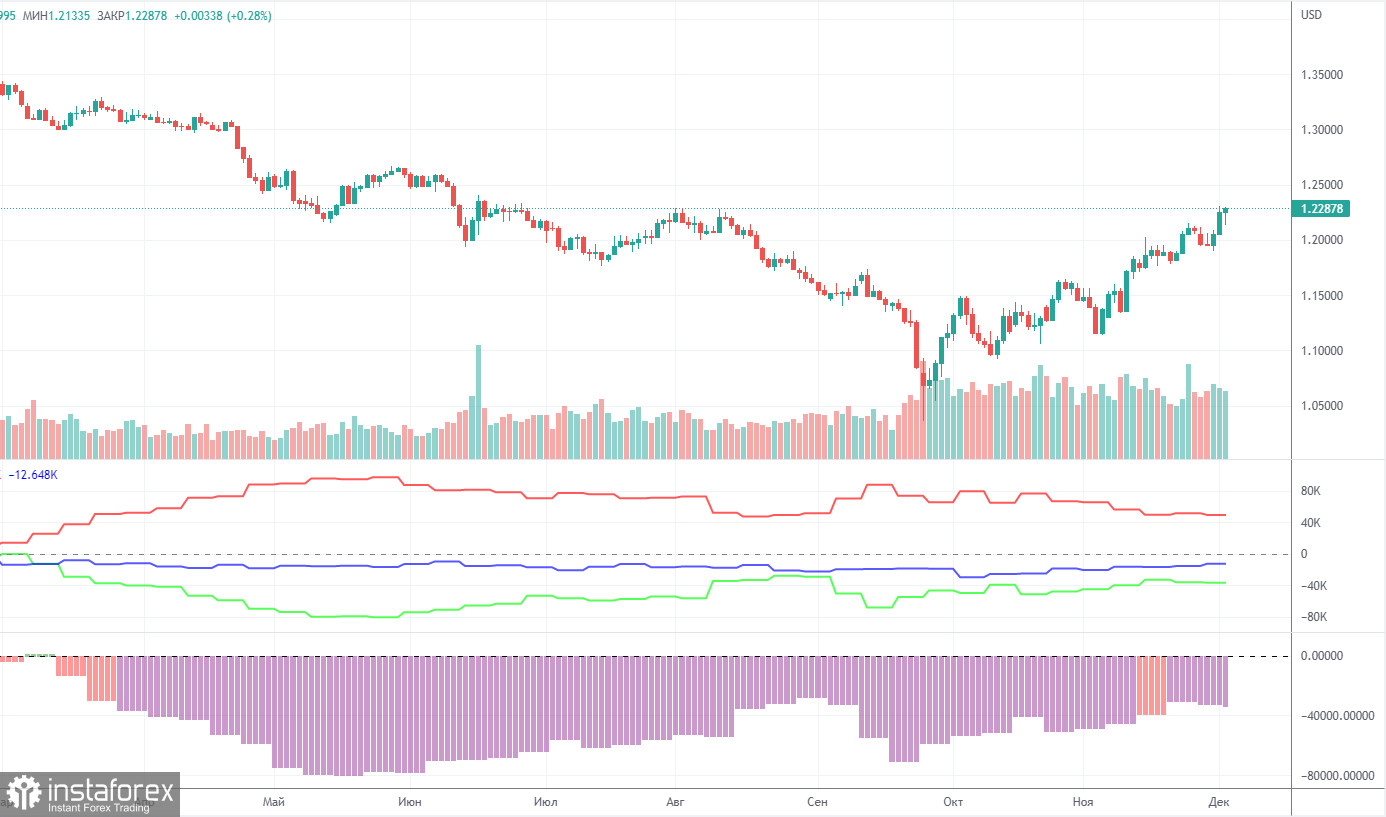
COT report
The latest COT report on the British pound indicated increasing bearish sentiment for the second consecutive week. In the given period, the non-commercial group closed 5,000 BUY contracts and 4,000 SELL contracts. Thus, the net position of non-commercial traders decreased by 1,000. The net position is growing during the last months, but the sentiment of the big players is still bearish, and the GBP is rising against the USD, but it is very difficult to answer the question why it does so. We don't exclude the option in which the pound could sharply fall in the near future. Take note that both major pairs are moving almost equally now, but the euro's net position is positive and even implies that the upward momentum will end soon, while it is negative for the pound... The non-commercial group now has a total of 62,000 short positions and 28,500 long positions. The difference, as you can see, is very large.
As for the total number of open Buy and Sell, the bulls have the advantage by 13,000. We are still skeptical about the British currency's growth in the long term, although there are technical reasons for it, but the foundation or geopolitics obviously do not imply such a solid strengthening of the pound.
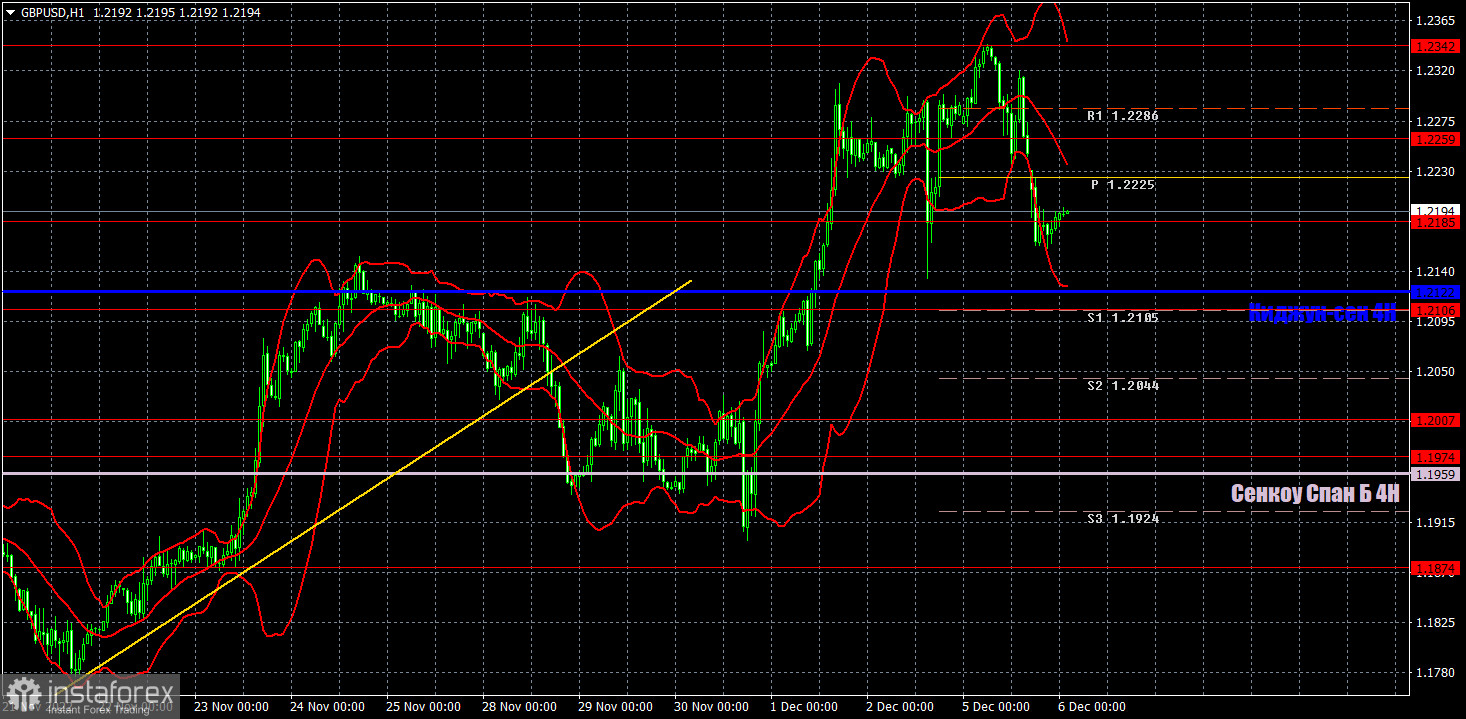
H1 chart of GBP/USD
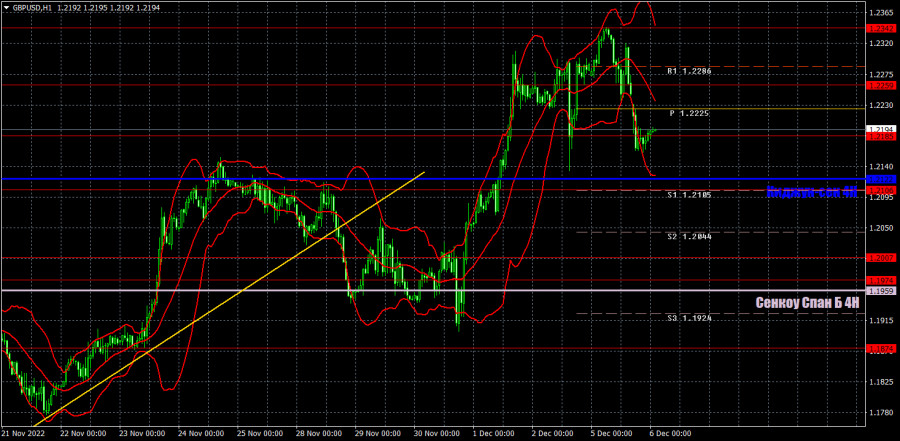
The pair continues to trade very high on the one-hour chart, but still tries to start a bearish correction. The pair has been rising for several weeks for no reason, yesterday is hardly indicative, although, the dollar did have reasons to rise on Monday. But if it strengthens today (when the calendar of events will be empty), then it will be possible to draw louder conclusions that the market was saturated with long positions on the pound and is now ready for shorts. On Tuesday, the pair may trade at the following levels: 1.1760, 1.1874, 1.1974-1.2007, 1.2106, 1.2185, 1.2259, 1.2342, 1.2429-1.2458. The Senkou Span B (1.1959) and Kijun Sen (1.2122) lines may also generate signals. Pullbacks and breakouts through these lines may produce signals as well. A Stop Loss order should be set at the breakeven point after the price passes 20 pips in the right direction. Ichimoku indicator lines may move during the day, which should be taken into account when determining trading signals. In addition, the chart does illustrate support and resistance levels, which could be used to lock in profits. On Tuesday, there are no important reports or events in the UK and the US. It would be nice if traders find any reason to sell the pair today. Because then it will be possible to consider that the bearish correction, which we have been waiting for, has finally started.
What we see on the trading charts:
Price levels of support and resistance are thick red lines, near which the movement may end. They do not provide trading signals.
The Kijun-sen and Senkou Span B lines are the lines of the Ichimoku indicator, moved to the one-hour chart from the 4-hour one. They are strong lines.
Extreme levels are thin red lines from which the price bounced earlier. They provide trading signals.
Yellow lines are trend lines, trend channels, and any other technical patterns.
Indicator 1 on the COT charts reflects the net position size of each category of traders.
Indicator 2 on the COT charts reflects the net position size for the non-commercial group.