There were several good entry signals yesterday. Let us have a look at the 5-minute chart and figure out what happened. In my morning forecast, I pointed out the levels of 1.2316 and 1.2261 and recommended making market entry decisions with these levels in mind. The pair broke below 1.2316 and performed an upward retest of this level, creating a sell signal and pushing GBP/USD down to 1.2261. This allowed bears to take a profit of 50 pips. After the pair hit 1.2261 and the release of weak PMI data, bulls regained the initiative. The resulting false breakout created a buy signal, sending GBP/USD up by 35 pips. However, it came under renewed pressure afterwards resulting in the pair sliding down to 1.2283. This in turn created another buy signal and pushed the pound sterling up by 30 pips.
When to open long positions on GBP/USD:
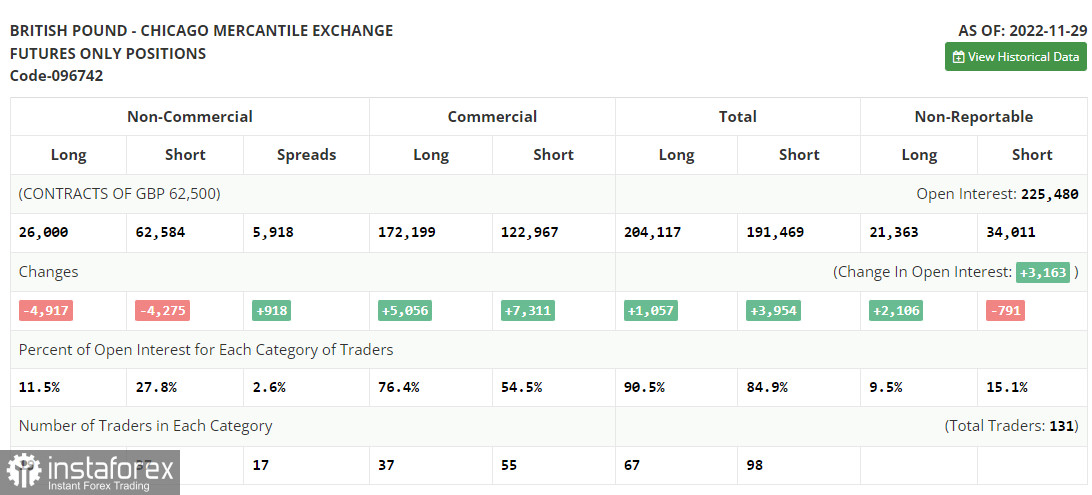
First, let us have a look at the situation in the futures market. According to the Commitment of Traders (COT) report for November 29, both net long and net short positioning decreased. The latest statistic data is hardly optimistic. The contraction in UK manufacturing and services sectors indicates that recession has begun. The Bank of England does not plan to deal with the recession at this point because it is primarily focused on dealing with high inflation, which continues to climb, judging by the latest data. As a result, traders prefer to sit on the sidelines without buying or selling the pound sterling. Furthermore, given the pair's upside trajectory since November, it is not particularly desirable to go long on GBP/USD at its current highs. The latest US data has been strong, which will likely lead to renewed demand for the US dollar after the Fed policy meeting next week. The latest COT report indicated that long non-commercial positions decreased by 4,197 to 26,000, while short non-commercial positions fell by 4,275 to 62,584. As a result, the total non-commercial net position remained negative and stood at -36,584 against -35,942 a week ago. The weekly closing price increased to 1.1958 from 1.1892.
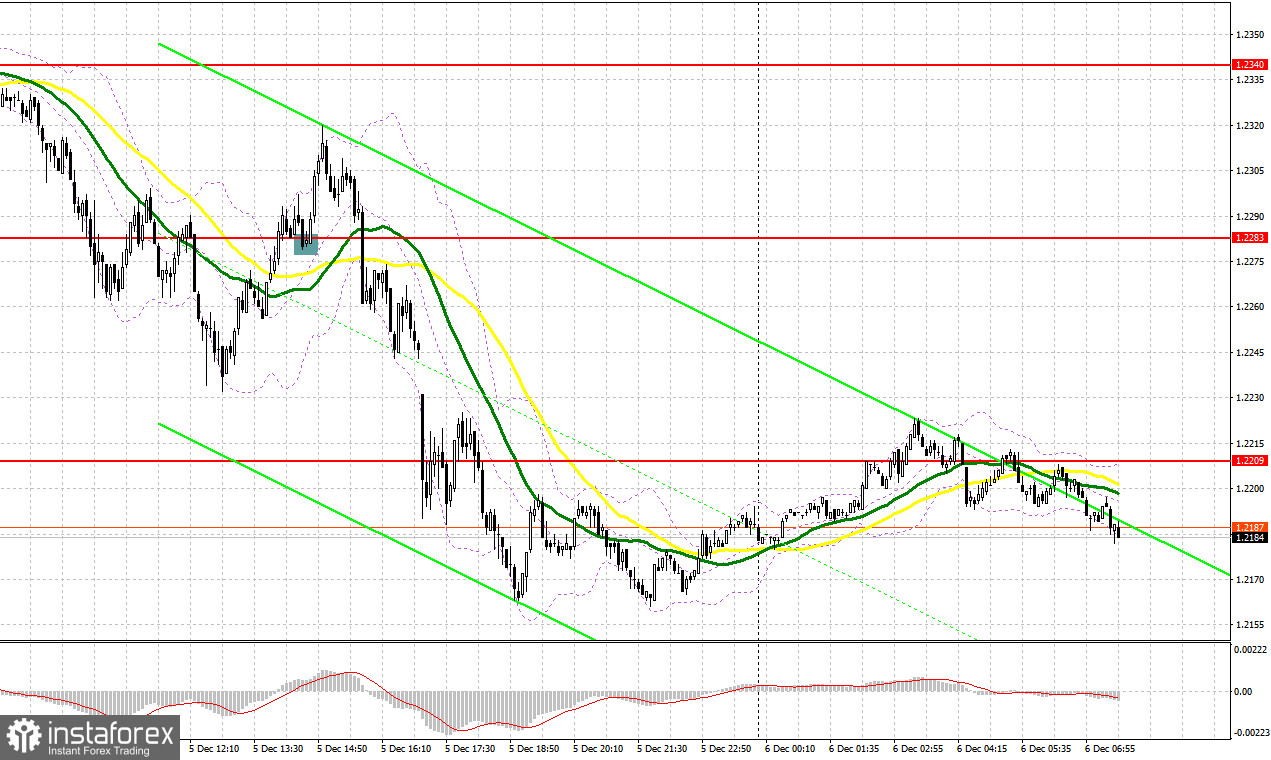
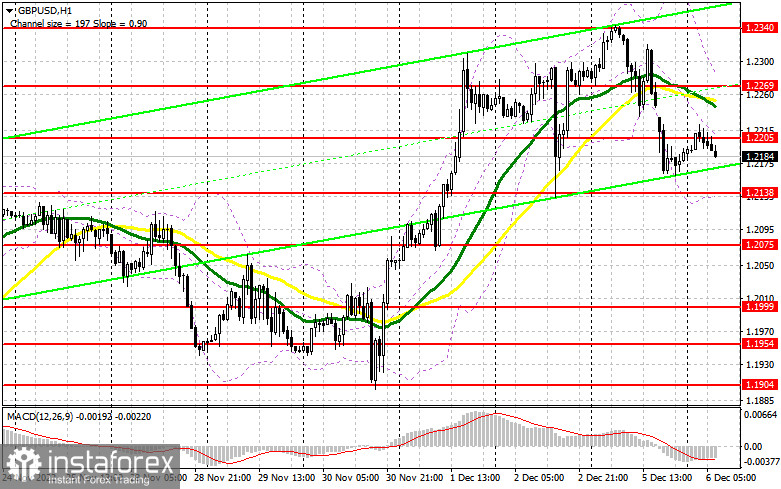
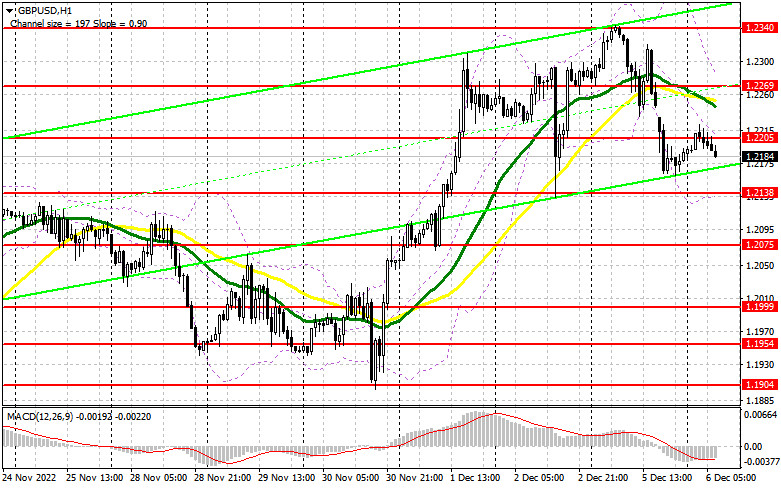
There are no UK data releases today that could help GBP bulls regain the advantage in the market and end the downward retracement. Today, traders will likely be focused on US economic data in the afternoon. To restore the pair's upward momentum, bulls will have to hold on to the closest support at 1.2138 - if they lose it, the short-term uptrend will end. On the other hand, a false breakout of this level will create a buy signal, confirming that bullish traders are in the market. Afterwards, GBP/USD may test 1.2205 once again, a level which the pair failed to break above during today's Asian session. It will be very difficult to extend upward momentum without surpassing this level. A breakout above 1.2205 and a downward retest will open the way towards the high at 1.2269. Moving averages, which lie at this level, will limit the pair's upward potential. The most distant target is 1.2340, where a major bear capitulation is likely to occur. I recommend taking profit at this level. If GBP/USD declines and bulls are inactive at 1.2138, the pound sterling will come under increased pressure. In this case, I recommend to open long positions only during a false breakout of 1.2075. You can buy the pair immediately if it rebounds from of 1.1999, keeping in mind a downward intraday correction of 30-35 pips.
When to open short positions on GBP/USD:
Bears are in control of the market, but they would need to hit yesterday's lows to reverse the current trend. To do so, they will first have to hold on to the resistance level of 1.2205, which was formed during the Asian session. If GBP/USD moves up, a false breakout of this level will create a sell signal. The pair may drop to its closest support level of 1.2138 afterwards. A breakout below this level and an upward retest will create another sell signal with the low at 1.2075 being the target. This will increase pressure on the pound sterling. The most distant target is 1.1999, where I recommend taking profit. If the pair tests 1.1999, it will signal a new bearish trend and severely impact the position of GBP bulls. If GBP/USD rises and bearish traders are inactive at 1.2205, bulls will regain the initiative, pushing the pair towards the high of 1.2269. A false breakout of this level will create a new entry point for opening short positions, assuming that the pair will move down. If bears remain idle at this level, you can buy GBP/USD immediately if it surges towards the high of 1.2340 and bounces off it, keeping in mind a downward intraday correction of 30-35 pips.
Indicators' signals:
Moving averages
Trading is carried out below the 30-day and 50-day moving averages, which indicates that the pair remains under pressure.
Note: The period and prices of moving averages are considered by the author on the H1 (1-hour) chart and differ from the general definition of the classic daily moving averages on the daily D1 chart.
Bollinger Bands
If GBP/USD breaks above the indicator's upper border at 1.2269, the pound sterling will begin a new uptrend. A breakout below the indicator's lower border at 1.2138 will increase pressure on the pair.
Description of indicators
• Moving average (moving average, determines the current trend by smoothing out volatility and noise). Period 50. It is marked yellow on the chart.
• Moving average (moving average, determines the current trend by smoothing out volatility and noise). Period 30. It is marked green on the chart.
• MACD indicator (Moving Average Convergence/Divergence - convergence/divergence of moving averages) Quick EMA period 12. Slow EMA period to 26. SMA period 9
• Bollinger Bands (Bollinger Bands). Period 20
• Non-commercial speculative traders, such as individual traders, hedge funds, and large institutions that use the futures market for speculative purposes and meet certain requirements.
• Long non-commercial positions represent the total long open position of non-commercial traders.
• Short non-commercial positions represent the total short open position of non-commercial traders.
• Total non-commercial net position is the difference between the short and long positions of non-commercial traders.