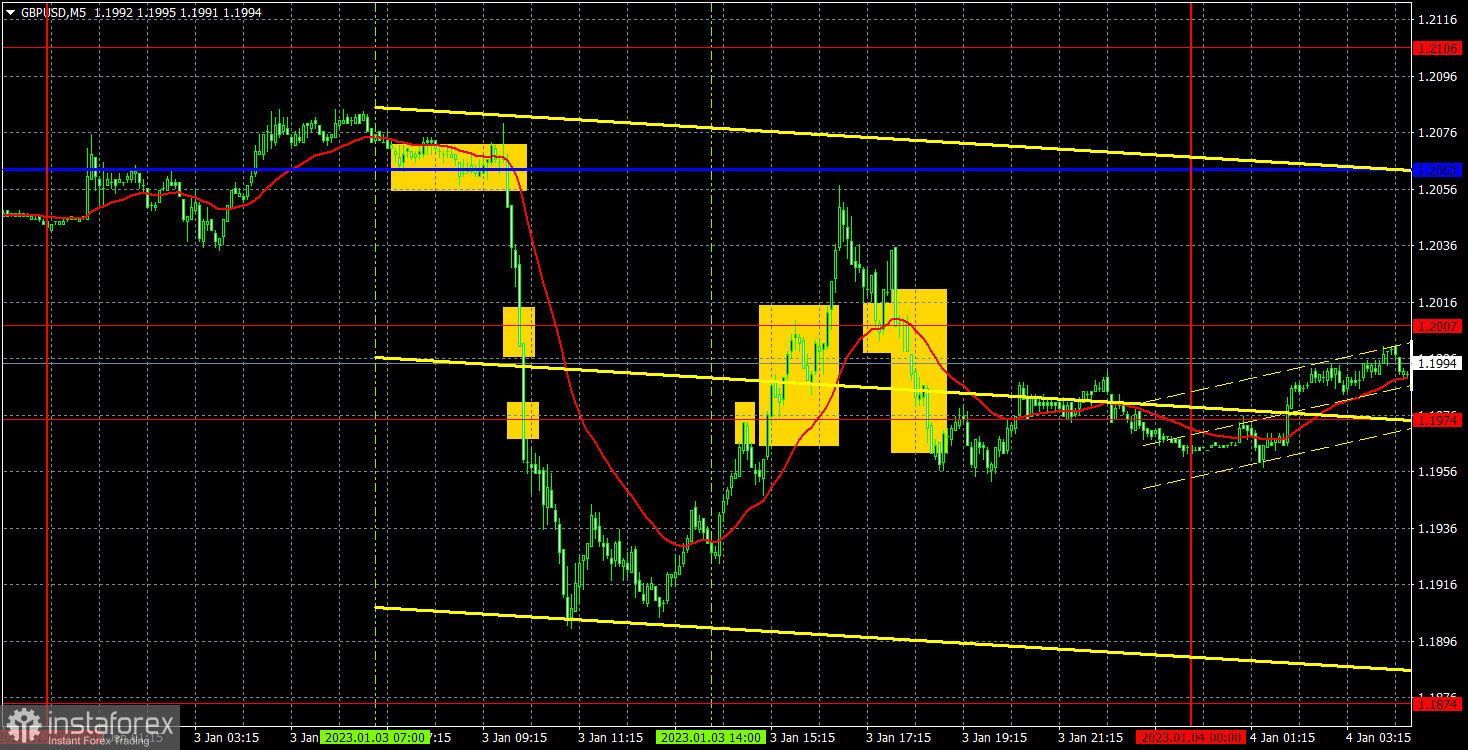
empty
04.01.2023 08:13 AM
Outlook and trading signals for GBP/USD on January 4. COT report. Analysis of market situation. The pound had a good rest and resumed falling.

M5 chart of GBP/USD

This image is no longer relevant

GBP/USD also plummeted on Tuesday, left the horizontal channel and is now set to continue falling. It is hard to say why the pound plunged yesterday since there were no important events in the UK, and the latest reports referred more to the euro and the dollar, but not to the pound. Nevertheless, the pound was also falling actively, so we conclude that the nature of this movement is technical. If you remember, I have mentioned many times in recent weeks that the pound rose 2000 points too quickly and sharply. The 2000 points is half of the whole downtrend, which lasted 2 years. And this distance has been covered in only 2.5 months. Therefore, the bearish correction was necessary to "restore justice". Thus, from a technical perspective, it is absolutely logical that the pound is falling.

There were a lot of trading signals yesterday because the movement was volatile. Let's break them down. At the beginning of the European session, the pair crossed the critical line so traders had to open the short positions. Then the pair passed 1.2007 and 1.1974 and it passed about 60 more points to the downside. Unfortunately, GBP did not reach 1.1874, and a strong upward movement began in the afternoon. So, when the price crossed 1.1974-1.2007, the shorts should have been closed. Unless, traders closed them earlier manually. You could only get several dozens of points on this trade, and it wasn't possible to do so using the buy signal because the pair failed to reach the critical line. But the long position closed at Stop Loss without loss. The last sell signal should not be executed, as it was formed quite late.
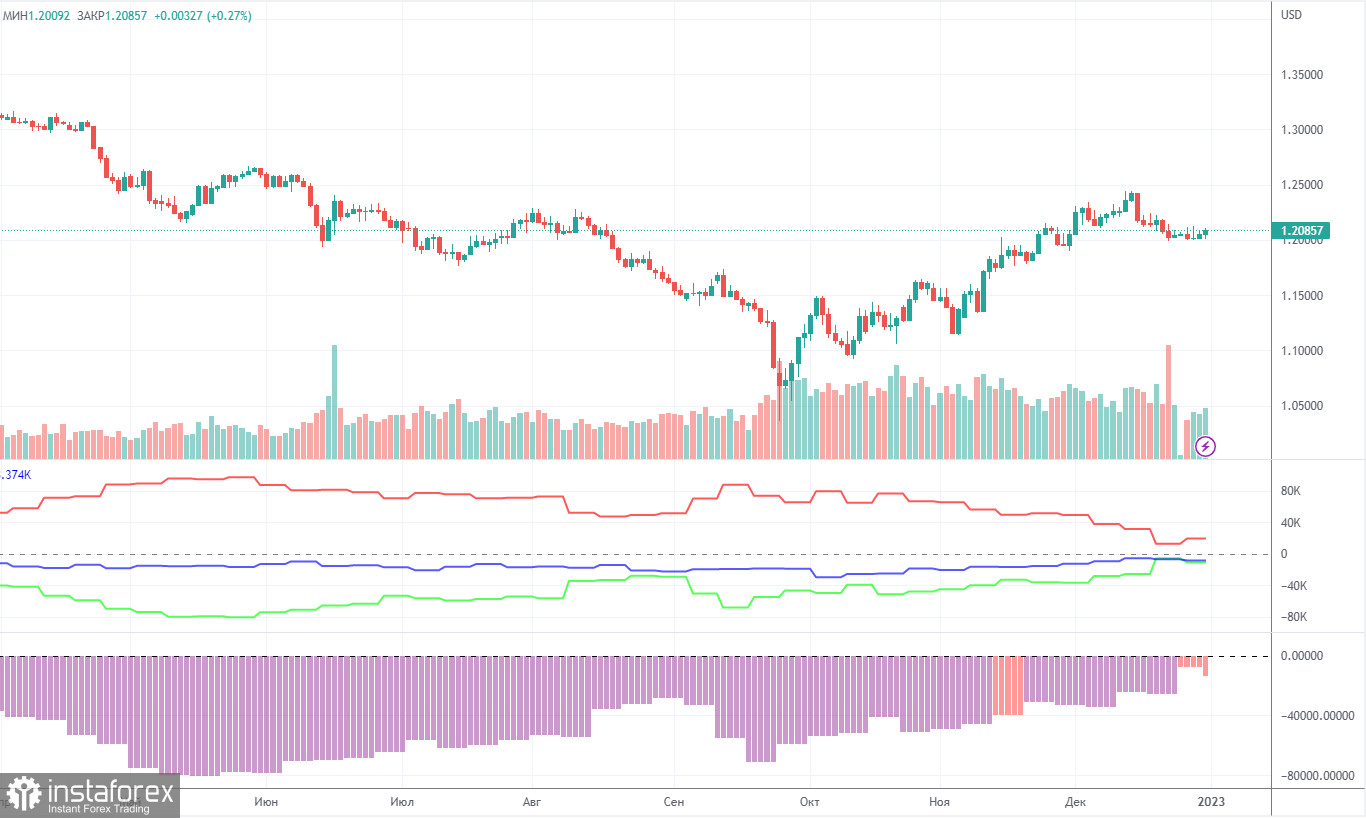
COT report

This image is no longer relevant

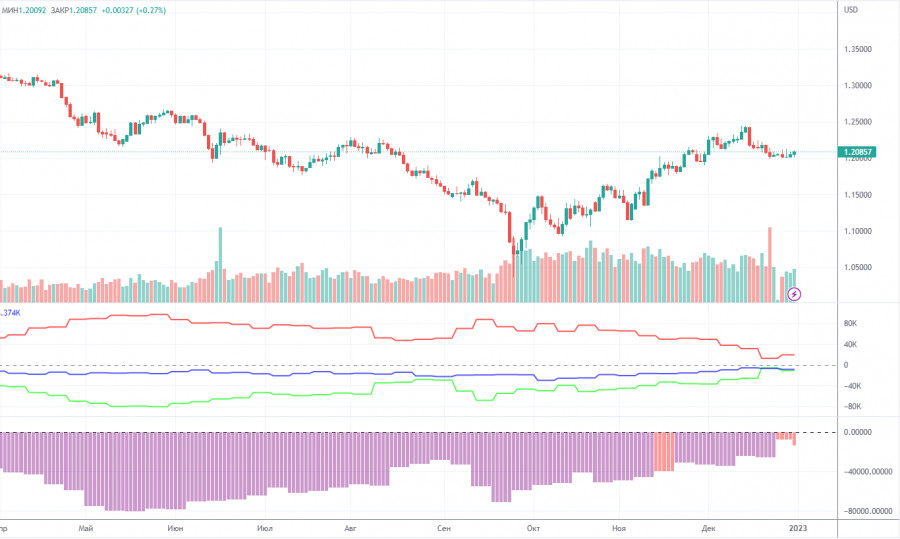
The latest COT report showed that bearish sentiment had weakened. During the given period, non-commercial traders opened 5,300 long positions and as many as 10,600 short positions. Thus, the net position fell by about 5,300. This figure has been on the rise for several months, and the sentiment may become bullish in the near future. Although the pound has grown against the dollar for the last few weeks, it is still difficult to answer why it keeps rising. On the other hand, it could fall in the near future (in the mid-term prospect) because it still needs a correction. In general, in recent months the COT reports correspond to the pound's movements so there shouldn't be any questions. Since the net position is not even bullish yet, buying may continue for a few months to come. Non-commercial traders now hold 40,600,000 long positions and 51,500 short ones. I am still skeptical about the pound's long term growth, though there are technical reasons for it. At the same time, fundamental and geopolitical factors signal that the currency is unlikely to strengthen significantly.
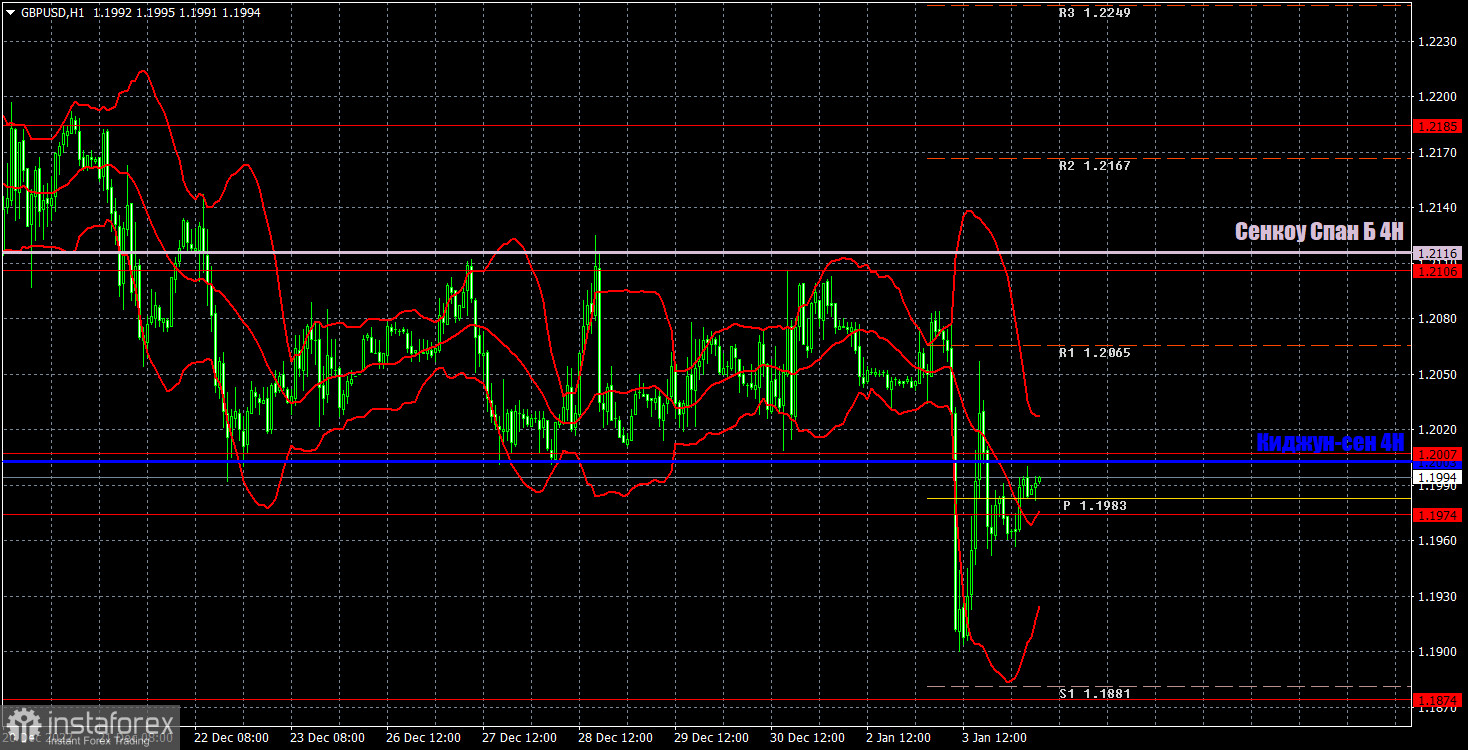
H1 chart of GBP/USD

This image is no longer relevant

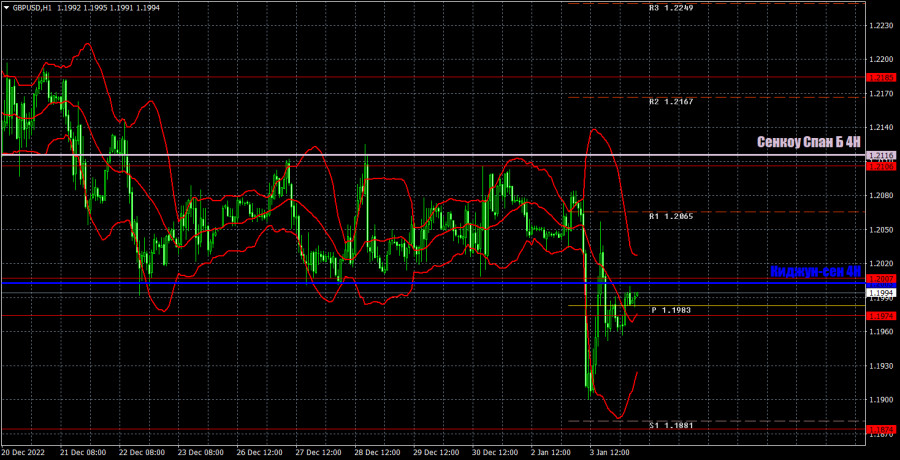
GBP/USD left the horizontal channel on the one-hour chart and now it finally has a real opportunity to continue moving downward, as I expected. The price is also located below the Ichimoku indicator lines, which are gaining strength again with the resumption of the trend movement. On January 4, the pair may trade at the following levels: 1.1645, 1.1760, 1.1874, 1.1974-1.2007, 1.2106, 1.2185, 1.2259. Senkou Span B (1.2216) and Kijun Sen (1.2063) lines may also generate signals. Pullbacks and breakouts through these lines may produce signals as well. A Stop Loss order should be set at the breakeven point after the price passes 20 pips in the right direction. Ichimoku indicator lines may move during the day, which should be taken into account when determining trading signals. In addition, the chart does illustrate support and resistance levels, which could be used to lock in profits. On Wednesday, there are no important events planned for Great Britain. Meanwhile, the US will release its ISM manufacturing activity index. The Federal Reserve minutes will be announced in the evening but everyone is focused on the ISM index.

What we see on the trading charts:

Price levels of support and resistance are thick red lines, near which the movement may end. They do not provide trading signals.

The Kijun-sen and Senkou Span B lines are the lines of the Ichimoku indicator, moved to the one-hour chart from the 4-hour one. They are strong lines.

Extreme levels are thin red lines from which the price bounced earlier. They provide trading signals.

Yellow lines are trend lines, trend channels, and any other technical patterns.

Indicator 1 on the COT charts reflects the net position size of each category of traders.

Indicator 2 on the COT charts reflects the net position size for the non-commercial group.

Paolo Greco,
Analytical expert of InstaForex
© 2007-2025
Select timeframe
5
min
15
min
30
min
1
hour
4
hours
1
day
1
week
Earn on cryptocurrency rate changes with InstaForex
Download MetaTrader 4 and open your first trade
  • Grand Choice
    Contest by
    InstaForex
    InstaForex always strives to help you
    fulfill your biggest dreams.
    JOIN CONTEST

Recommended Stories

How to Trade the GBP/USD Pair on May 22? Simple Tips and Trade Analysis for Beginners

Analysis of Wednesday's Trades 1H Chart of GBP/USD The GBP/USD pair maintained its upward trend on Wednesday, a movement that has developed over the past two weeks. Recall that

Paolo Greco 06:31 2025-05-22 UTC+2

How to Trade the EUR/USD Pair on May 22? Simple Tips and Trade Analysis for Beginners

Analysis of Wednesday's Trades 1H Chart of EUR/USD On Wednesday, the EUR/USD currency pair continued its upward movement calmly and steadily. The price broke through the 1.1267 level, which

Paolo Greco 06:31 2025-05-22 UTC+2

Trading Recommendations and Analysis for GBP/USD on May 22: The Pound Breaks Through Key Levels

The GBP/USD currency pair also resumed its upward movement on Wednesday. The rise of the British pound, which in reality still reflects the fall of the US dollar, began overnight

Paolo Greco 03:30 2025-05-22 UTC+2

Trading Recommendations and Analysis for EUR/USD on May 22: Reasons Don't Matter and Aren't Needed

The EUR/USD currency pair resumed its upward movement on Wednesday, and it is now safe to say that the uptrend is present not only in the hourly timeframe but also

Paolo Greco 03:30 2025-05-22 UTC+2

How to Trade the GBP/USD Pair on May 21? Simple Tips and Trade Analysis for Beginners

Analysis of Tuesday's Trades 1H Chart of GBP/USD The GBP/USD pair mainly traded sideways on Tuesday, but early Wednesday morning it surged upward. On the 4-hour timeframe, it's clear that

Paolo Greco 06:17 2025-05-21 UTC+2

How to Trade the EUR/USD Pair on May 21? Simple Tips and Trade Analysis for Beginners

Analysis of Tuesday's Trades 1H Chart of EUR/USD On Tuesday, the EUR/USD currency pair traded sideways, but it resumed its upward movement early Wednesday morning. This indicates that the ongoing

Paolo Greco 06:17 2025-05-21 UTC+2

Trading Recommendations and Analysis for GBP/USD on May 21: The British Pound Remains in a Flat Range

The GBP/USD currency pair continued to trade within the boundaries of a sideways channel on Tuesday, which has existed for over a month and is clearly visible. While on Monday

Paolo Greco 03:48 2025-05-21 UTC+2

Trading Recommendations and Analysis for EUR/USD on May 21: The Euro Continues to Climb

The EUR/USD currency pair mostly traded sideways throughout Tuesday. Unlike Monday, traders had no formal reason to sell the dollar, something they've been doing frequently lately. As a reminder, Monday's

Paolo Greco 03:48 2025-05-21 UTC+2

How to Trade the GBP/USD Pair on May 20? Simple Tips and Trade Analysis for Beginners

Analysis of Monday's Trades 1H Chart of GBP/USD Throughout Monday, the GBP/USD pair continued its upward movement, and at first glance, it might seem that a new uptrend is forming

Paolo Greco 05:40 2025-05-20 UTC+2

How to Trade the EUR/USD Pair on May 20? Simple Tips and Trade Analysis for Beginners

Analysis of Monday's Trades 1H Chart of EUR/USD The EUR/USD currency pair surged upward on Monday with renewed strength. But what justified this move, given that Monday's macroeconomic and fundamental

Paolo Greco 05:40 2025-05-20 UTC+2
Can't speak right now?
Ask your question in the chat.
Widget callback
 

Dear visitor,

Your IP address shows that you are currently located in the USA. If you are a resident of the United States, you are prohibited from using the services of InstaFintech Group including online trading, online transfers, deposit/withdrawal of funds, etc.

If you think you are seeing this message by mistake and your location is not the US, kindly proceed to the website. Otherwise, you must leave the website in order to comply with government restrictions.

Why does your IP address show your location as the USA?

  • - you are using a VPN provided by a hosting company based in the United States;
  • - your IP does not have proper WHOIS records;
  • - an error occurred in the WHOIS geolocation database.

Please confirm whether you are a US resident or not by clicking the relevant button below. If you choose the wrong option, being a US resident, you will not be able to open an account with InstaForex anyway.

We are sorry for any inconvenience caused by this message.