empty
25.01.2023 07:50 AM
Outlook and trading signals for EUR/USD on January 25. COT report. Analysis of market situation. Staying flat on the highs.

M5 chart of EUR/USD

This image is no longer relevant

EUR/USD did not show any interesting movements on Tuesday. Moreover, the movements were almost an exact copy of the previous day. The euro tried to settle below the critical line, but failed and so it returned to the area just above the Kijun-sen line. Macro data were released yesterday, some of which were worth mentioning, however, I have already warned you that the market would only react if the actual values significantly differed from projections. There was no such thing, so traders did not react to the PMIs on the manufacturing and services sectors in the US and EU. Furthermore, traders certainly did not hear anything new from European Central Bank President Christine Lagarde's speech. Thus, the euro remains near its local highs and is still unable to start a bearish correction.

There was a buy signal on Tuesday. The Kijun-sen line and 1.0868 level should be considered as an area. The price fell to this area at the European trading session and stayed in it for most of the day. When it finally left this area, half of the US session had already passed. Therefore, it was up to traders to decide if they wanted to open a long position. In any case, there was no loss on this transaction.
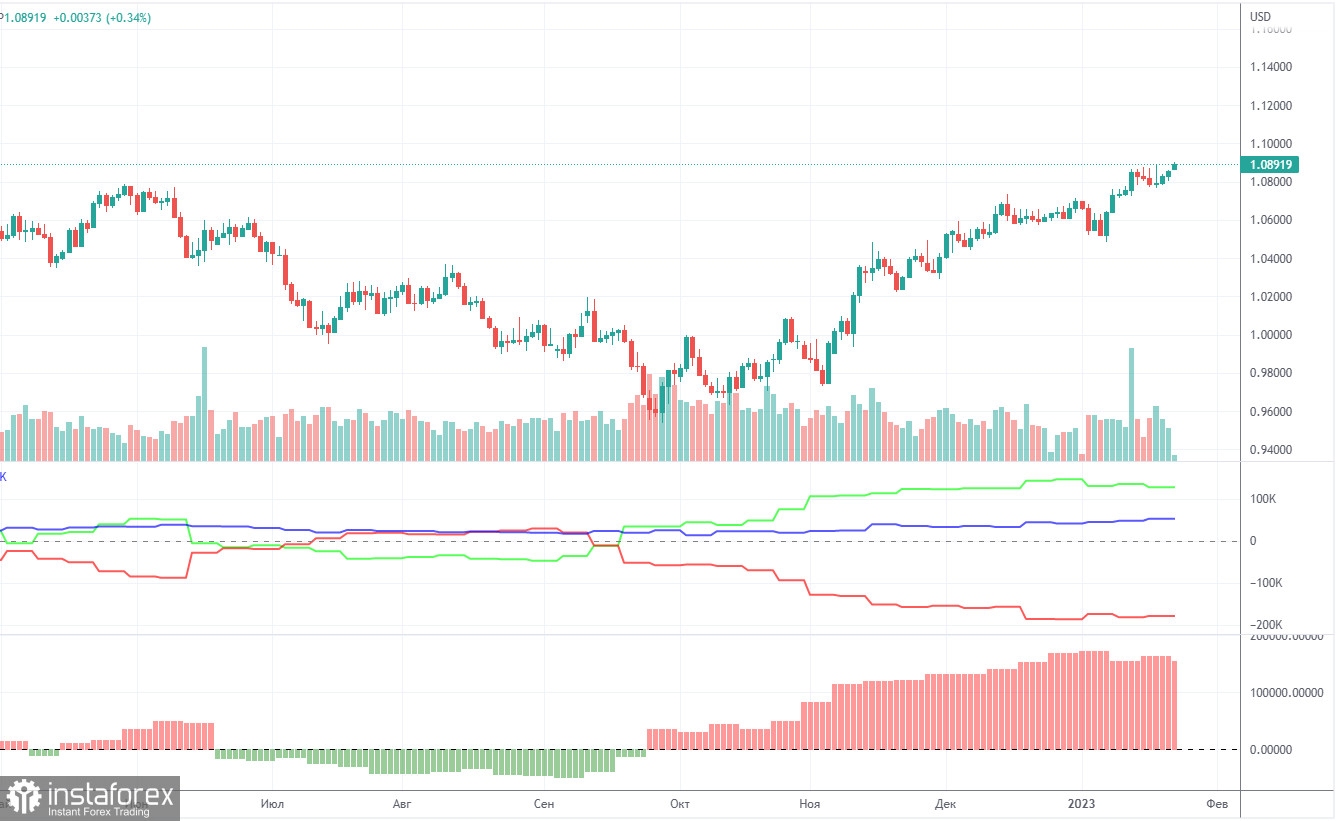
COT report

This image is no longer relevant

The COT reports for the euro in the last few months have been fully consistent with what is happening in the market. You can clearly see on the chart that the net position of big players (the second indicator) has been growing since early September. Around the same time, the euro started to grow. At this time, the net position of the non-commercial traders has been bullish and strengthens almost every week, but it is a rather high value that allows us to assume that the uptrend will end soon. Notably, the green and red lines of the first indicator have moved far apart from each other, which often precedes the end of the trend. During the given period, the number of long positions held by non-commercial traders decreased by 10,300, whereas the number of short positions fell by 2,300. Thus, the net positions decreased by 8,000. Now the number of long positions is higher than the number of short positions opened by non-commercial traders by 127,000. From a technical perspective, a bearish correction should have started a long time ago. In my opinion, this process can not continue for another 2 or 3 months. Even the net position indicator shows that we need to "unload" a bit, that is, to correct. The overall number of short orders exceeds the number of long orders by 52,000 (711,000 vs. 659,000).
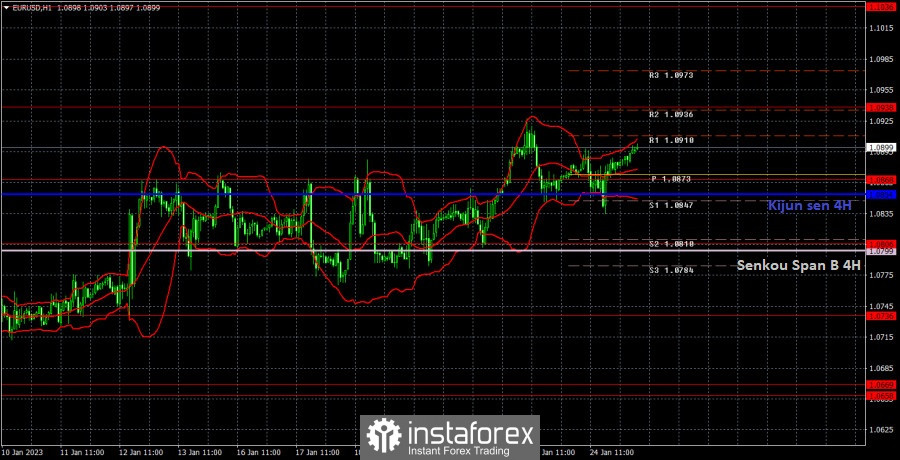
H1 chart of EUR/USD

This image is no longer relevant

EUR/USD maintains a bullish sentiment on the one-hour chart, staying above the lines of the Ichimoku indicator. Thus, the upward movement may persist in the near future, despite last week's flat. As we can see, there is still no way for the euro to correct, and traders prefer to buy the pair or not to do anything at all. On Wednesday, the pair may trade at the following levels: 1.0658-1.0669, 1.0736, 1.0806, 1.0868, 1.0938, 1.1036, 1.1137 and also Senkou Span B lines (1.0799) and Kijun Sen (1.0854). Lines of the Ichimoku indicator may move during the day, which should be taken into account when determining trading signals. There are also support and resistance levels, but signals are not formed near these levels. Bounces and breakouts of the extreme levels and lines could act as signals. Don't forget about stop-loss orders, if the price covers 15 pips in the right direction. This will prevent you from losses in case of a false signal. No important events or reports in the EU and the US for today. If the pair spent the first two days moving sideways, then there is a high probability that we will witness the same thing today.

What we see on the trading charts:

Price levels of support and resistance are thick red lines, near which the movement may end. They do not provide trading signals.

The Kijun-sen and Senkou Span B lines are the lines of the Ichimoku indicator, moved to the one-hour chart from the 4-hour one. They are strong lines.

Extreme levels are thin red lines from which the price bounced earlier. They provide trading signals.

Yellow lines are trend lines, trend channels, and any other technical patterns.

Indicator 1 on the COT charts reflects the net position size of each category of traders.

Paolo Greco,
Analytical expert of InstaForex
© 2007-2025
Select timeframe
5
min
15
min
30
min
1
hour
4
hours
1
day
1
week
Earn on cryptocurrency rate changes with InstaForex
Download MetaTrader 4 and open your first trade
  • Grand Choice
    Contest by
    InstaForex
    InstaForex always strives to help you
    fulfill your biggest dreams.
    JOIN CONTEST

Recommended Stories

GBP/USD: Trading Plan for the U.S. Session on May 27th (Review of Morning Trades)

In my morning forecast, I highlighted the 1.3545 level and planned to make trading decisions based on it. Let's look at the 5-minute chart and see what happened. A decline

Miroslaw Bawulski 20:13 2025-05-27 UTC+2

EUR/USD: Trading Plan for the U.S. Session on May 27th (Review of the Morning Trades)

In my morning forecast, I highlighted the 1.1374 level and planned to make trading decisions based on it. Let's look at the 5-minute chart to analyze what happened. A decline

Miroslaw Bawulski 20:07 2025-05-27 UTC+2

How to Trade the GBP/USD Pair on May 27? Simple Tips and Trade Analysis for Beginners

Analysis of Monday's Trades 1H Chart of GBP/USD On Monday, the GBP/USD pair reached 1.3580 — heights the British pound hadn't seen in over three years. As we've said

Paolo Greco 07:04 2025-05-27 UTC+2

How to Trade the EUR/USD Pair on May 27? Simple Tips and Trade Analysis for Beginners

Analysis of Monday's Trades 1H Chart of EUR/USD The EUR/USD currency pair continued its upward movement on Monday, which had started back on Friday. Only in the second half

Paolo Greco 07:04 2025-05-27 UTC+2

Trading Recommendations and Analysis for GBP/USD on May 27: No Reason to Be Upset

The GBP/USD currency pair also traded higher on Monday, although it pulled back slightly during the day. This retreat followed the announcement that the increase in tariffs for the European

Paolo Greco 05:26 2025-05-27 UTC+2

Trading Recommendations and Analysis for EUR/USD on May 27: The Market Is Starting to Get Angry

On Monday, the EUR/USD currency pair initially rose following Trump's announcement that tariffs on EU goods would increase to 50% starting June 1. However, the pair subsequently fell after Trump

Paolo Greco 05:26 2025-05-27 UTC+2

GBP/USD: Trading Plan for the U.S. Session on May 26th (Review of Morning Trades)

In my morning forecast, I focused on the 1.3570 level and planned to make entry decisions around it. Let's look at the 5-minute chart and analyze what happened. A decline

Miroslaw Bawulski 15:03 2025-05-26 UTC+2

EUR/USD: Trading Plan for the U.S. Session on May 26th (Review of Morning Trades)

In my morning forecast, I focused on the 1.1416 level as a key area for making trading decisions. Let's look at the 5-minute chart and break down what happened. After

Miroslaw Bawulski 14:59 2025-05-26 UTC+2

How to Trade the GBP/USD Pair on May 26? Simple Tips and Trade Analysis for Beginners

Analysis of Friday's Trades 1H Chart of GBP/USD The GBP/USD pair also showed a confident upward movement on Friday, driven by the overall uptrend observed over the past two weeks

Paolo Greco 07:57 2025-05-26 UTC+2

How to Trade the EUR/USD Pair on May 26? Simple Tips and Trade Analysis for Beginners

Analysis of Friday's Trades 1H Chart of EUR/USD On Friday, the EUR/USD currency pair continued its upward movement after bouncing from the 1.1267 level during a brief correction. The uptrend

Paolo Greco 07:57 2025-05-26 UTC+2
Can't speak right now?
Ask your question in the chat.
Widget callback
 

Dear visitor,

Your IP address shows that you are currently located in the USA. If you are a resident of the United States, you are prohibited from using the services of InstaFintech Group including online trading, online transfers, deposit/withdrawal of funds, etc.

If you think you are seeing this message by mistake and your location is not the US, kindly proceed to the website. Otherwise, you must leave the website in order to comply with government restrictions.

Why does your IP address show your location as the USA?

  • - you are using a VPN provided by a hosting company based in the United States;
  • - your IP does not have proper WHOIS records;
  • - an error occurred in the WHOIS geolocation database.

Please confirm whether you are a US resident or not by clicking the relevant button below. If you choose the wrong option, being a US resident, you will not be able to open an account with InstaForex anyway.

We are sorry for any inconvenience caused by this message.