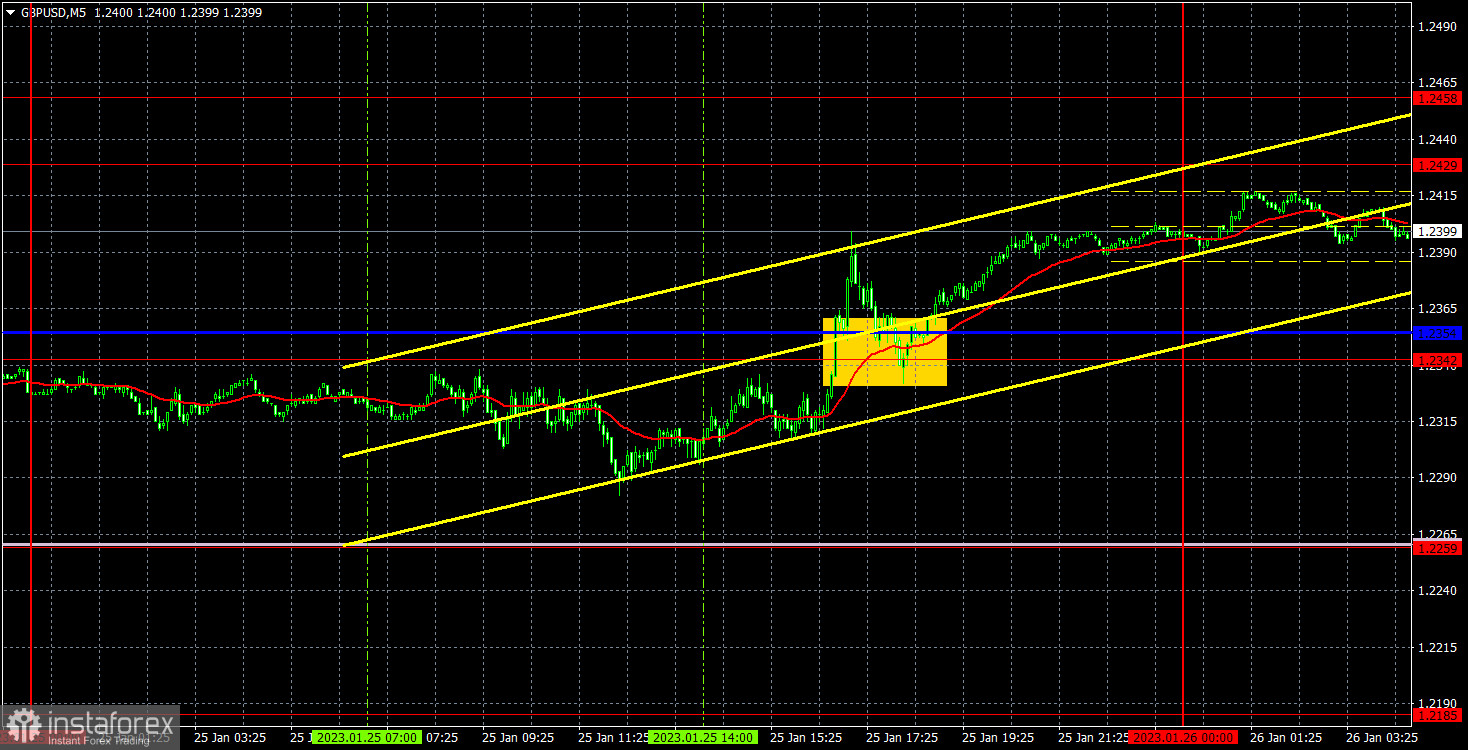
empty
26.01.2023 08:01 AM
Outlook and trading signals for GBP/USD on January 26. COT report. Analysis of market situation. The pound failed to develop a downward momentum.

M5 chart of GBP/USD

This image is no longer relevant

GBP/USD resumed growth on Wednesday, failing to settle below the important Senkou Span B line, and remains below the critical line. Therefore, we should talk about preserving the uptrend, although the previous local highs have not been updated yet. Nevertheless, the pound still finds grounds for a rather considerable growth, though there are technically no grounds. At the moment, either it will continue the upward movement, or it tries to stay in the channel of 1.2288-1.2429 until next week, which is when the meetings of the Bank of England and the Federal Reserve will take place. There has been a lot of talk lately about central bank rates and possible decisions to be made next week. I believe that even without any "surprises", the market has already worked out all of next week's decisions "in advance". The US GDP report for the fourth quarter will be released today, but it often coincides with the forecasts, so the reaction could be weak or nonexistent.

Yesterday, the pair did not have the best momentum, but it created one trading signal during the day. The pair crossed the 1.2342-1.2354 range, but it was in the middle of the US session, so the profit on this deal was not high. Traders managed to gain about 10-15 pips on it, which is better than nothing or a loss.
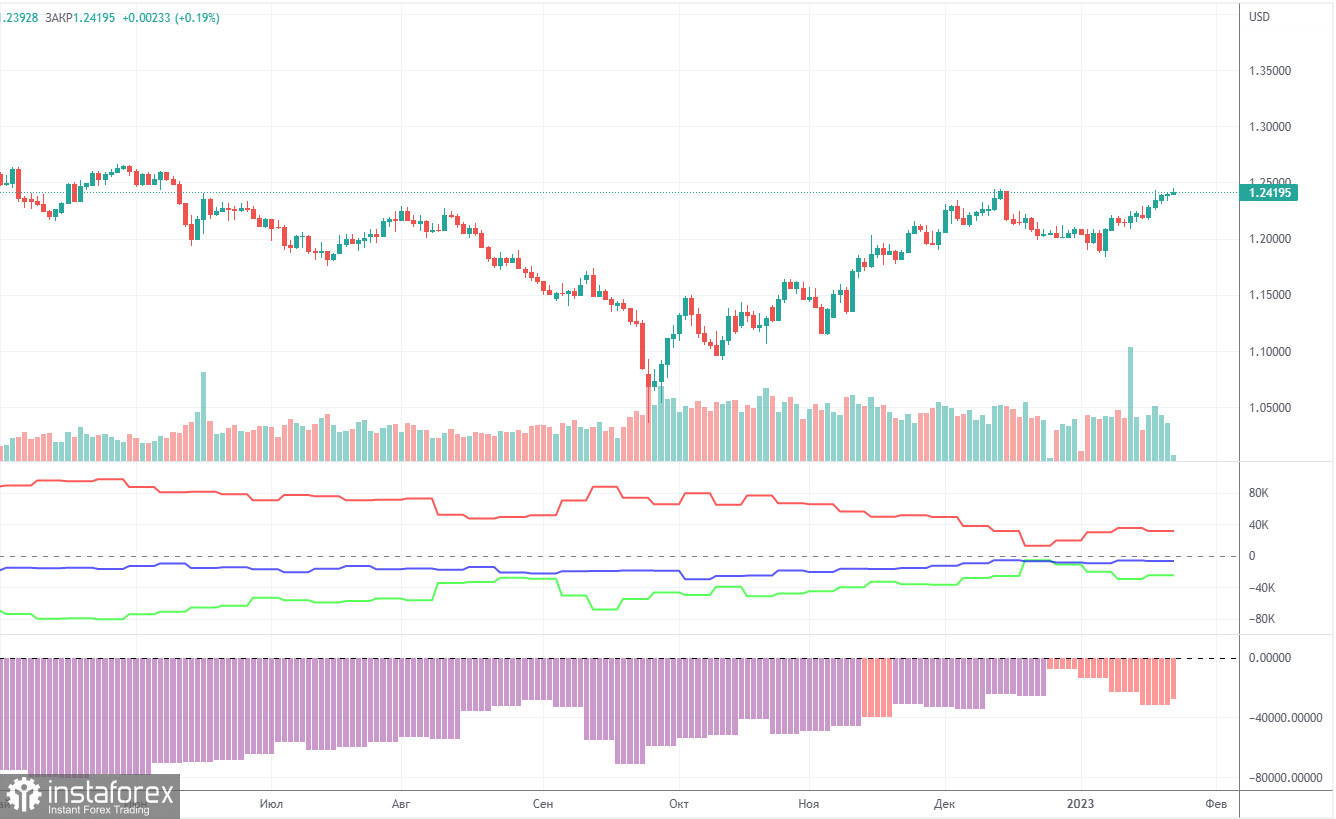
COT report

This image is no longer relevant

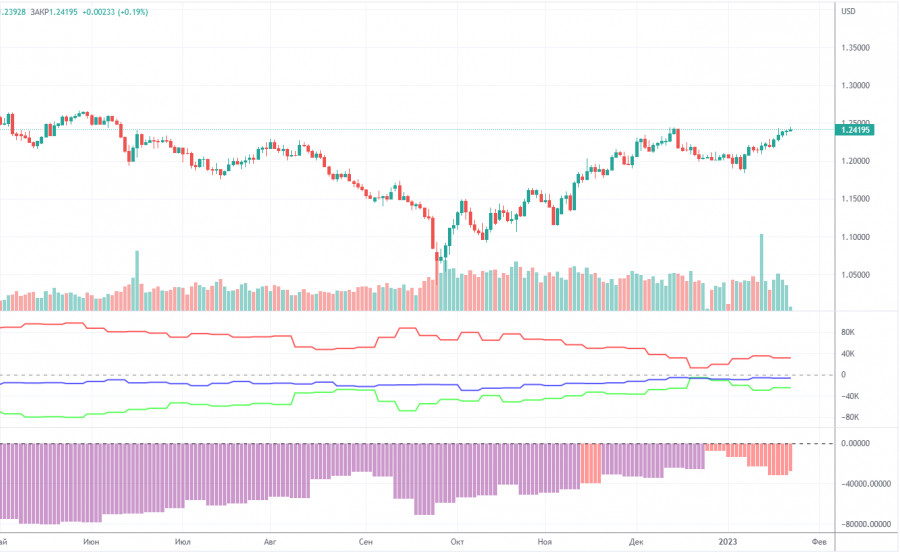
The latest COT report showed a decrease in bearish sentiment. During the given period, non-commercial traders opened 5,500 long positions and as many as 700 short positions. Thus, the net position increased by 4,800. This figure has been on the rise for several months, and the sentiment may become bullish in the near future, but it hasn't yet. Although the pound has grown against the dollar for the last few months, from a fundamental perspective, it is difficult to answer why it keeps rising. On the other hand, it could fall in the near future (in the mid-term prospect) because it still needs a correction. In general, in recent months the COT reports correspond to the pound's movements so there shouldn't be any questions. Since the net position is not even bullish yet, traders may continue to buy the pair over the next few months. Non-commercial traders now hold 41,500 long positions and 66,000 short ones. I remain skeptical about the pound's long term growth, though there are technical reasons for it. At the same time, fundamental and geopolitical factors signal that the currency is unlikely to strengthen significantly.
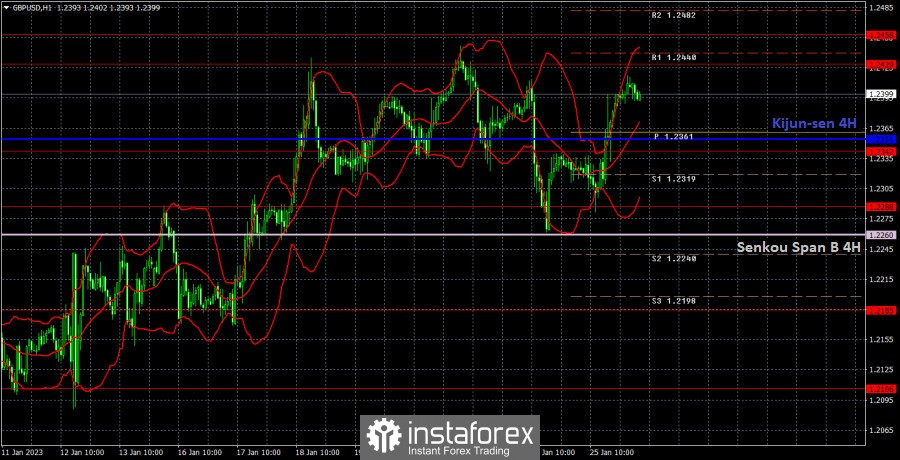
H1 chart of GBP/USD

This image is no longer relevant

On the one-hour chart, GBP/USD tried to break the uptrend but failed. So, now we have to wait for a new consolidation below the Kijun-Sen line, after which we need to overcome the Senkou Span B. Without this, there is no reason to expect a strong decline. It still has no specific reasons for growth, but the market stays bullish on the threshold of the Fed and BoE meetings. On January 26, the pair may trade at the following levels: 1.2106, 1.2185, 1.2288, 1.2342, 1.2429-1.2458, 1.2589, 1.2659. The Senkou Span B (1.2260) and Kijun Sen (1.2354) lines may also generate signals. Pullbacks and breakouts through these lines may produce signals as well. A Stop Loss order should be set at the breakeven point after the price passes 20 pips in the right direction. Ichimoku indicator lines may move during the day, which should be taken into account when determining trading signals. In addition, the chart does illustrate support and resistance levels, which could be used to lock in profits. On Thursday, there are no important events in the UK, but the US will release two reports, which can hypothetically influence the pair's movement. Of course, the GDP report for the fourth quarter will be the most important one, but the durable goods report has been attracting only a very small portion of traders' attention lately.

What we see on the trading charts:

Price levels of support and resistance are thick red lines, near which the movement may end. They do not provide trading signals.

The Kijun-sen and Senkou Span B lines are the lines of the Ichimoku indicator, moved to the one-hour chart from the 4-hour one. They are strong lines.

Extreme levels are thin red lines from which the price bounced earlier. They provide trading signals.

Yellow lines are trend lines, trend channels, and any other technical patterns.

Indicator 1 on the COT charts reflects the net position size of each category of traders.

Indicator 2 on the COT charts reflects the net position size for the non-commercial group.

Paolo Greco,
Analytical expert of InstaForex
© 2007-2025
Select timeframe
5
min
15
min
30
min
1
hour
4
hours
1
day
1
week
Earn on cryptocurrency rate changes with InstaForex
Download MetaTrader 4 and open your first trade
  • Grand Choice
    Contest by
    InstaForex
    InstaForex always strives to help you
    fulfill your biggest dreams.
    JOIN CONTEST

Recommended Stories

How to Trade the GBP/USD Pair on May 23? Simple Tips and Trade Analysis for Beginners

Analysis of Thursday's Trades 1H Chart of GBP/USD The GBP/USD pair didn't even attempt a correction on Thursday. While the euro faced bearish pressure from weak business activity indices

Paolo Greco 05:58 2025-05-23 UTC+2

How to Trade the EUR/USD Pair on May 23? Simple Tips and Trade Analysis for Beginners

Analysis of Thursday's Trades 1H Chart of EUR/USD On Thursday, the EUR/USD currency pair corrected to the nearest support level on the hourly timeframe, which was at 1.1267. Multiple factors

Paolo Greco 05:57 2025-05-23 UTC+2

Trading Recommendations and Analysis for GBP/USD on May 23: Pound Prepares for a Historic Breakout

The GBP/USD currency pair broke out of its sideways channel through the upper boundary, but it is in no hurry to continue rising. Traders appear to be gathering momentum

Paolo Greco 03:43 2025-05-23 UTC+2

Trading Recommendations and Analysis for EUR/USD on May 23: The Euro Couldn't Withstand the Pressure

On Thursday, the EUR/USD currency pair traded lower, which can be considered an exception to the general trend. Nearly all macroeconomic reports during the day were unfavorable for the euro

Paolo Greco 03:43 2025-05-23 UTC+2

How to Trade the GBP/USD Pair on May 22? Simple Tips and Trade Analysis for Beginners

Analysis of Wednesday's Trades 1H Chart of GBP/USD The GBP/USD pair maintained its upward trend on Wednesday, a movement that has developed over the past two weeks. Recall that

Paolo Greco 06:31 2025-05-22 UTC+2

How to Trade the EUR/USD Pair on May 22? Simple Tips and Trade Analysis for Beginners

Analysis of Wednesday's Trades 1H Chart of EUR/USD On Wednesday, the EUR/USD currency pair continued its upward movement calmly and steadily. The price broke through the 1.1267 level, which

Paolo Greco 06:31 2025-05-22 UTC+2

Trading Recommendations and Analysis for GBP/USD on May 22: The Pound Breaks Through Key Levels

The GBP/USD currency pair also resumed its upward movement on Wednesday. The rise of the British pound, which in reality still reflects the fall of the US dollar, began overnight

Paolo Greco 03:30 2025-05-22 UTC+2

Trading Recommendations and Analysis for EUR/USD on May 22: Reasons Don't Matter and Aren't Needed

The EUR/USD currency pair resumed its upward movement on Wednesday, and it is now safe to say that the uptrend is present not only in the hourly timeframe but also

Paolo Greco 03:30 2025-05-22 UTC+2

How to Trade the GBP/USD Pair on May 21? Simple Tips and Trade Analysis for Beginners

Analysis of Tuesday's Trades 1H Chart of GBP/USD The GBP/USD pair mainly traded sideways on Tuesday, but early Wednesday morning it surged upward. On the 4-hour timeframe, it's clear that

Paolo Greco 06:17 2025-05-21 UTC+2

How to Trade the EUR/USD Pair on May 21? Simple Tips and Trade Analysis for Beginners

Analysis of Tuesday's Trades 1H Chart of EUR/USD On Tuesday, the EUR/USD currency pair traded sideways, but it resumed its upward movement early Wednesday morning. This indicates that the ongoing

Paolo Greco 06:17 2025-05-21 UTC+2
Can't speak right now?
Ask your question in the chat.
Widget callback
 

Dear visitor,

Your IP address shows that you are currently located in the USA. If you are a resident of the United States, you are prohibited from using the services of InstaFintech Group including online trading, online transfers, deposit/withdrawal of funds, etc.

If you think you are seeing this message by mistake and your location is not the US, kindly proceed to the website. Otherwise, you must leave the website in order to comply with government restrictions.

Why does your IP address show your location as the USA?

  • - you are using a VPN provided by a hosting company based in the United States;
  • - your IP does not have proper WHOIS records;
  • - an error occurred in the WHOIS geolocation database.

Please confirm whether you are a US resident or not by clicking the relevant button below. If you choose the wrong option, being a US resident, you will not be able to open an account with InstaForex anyway.

We are sorry for any inconvenience caused by this message.