When to open long positions on EUR/USD:
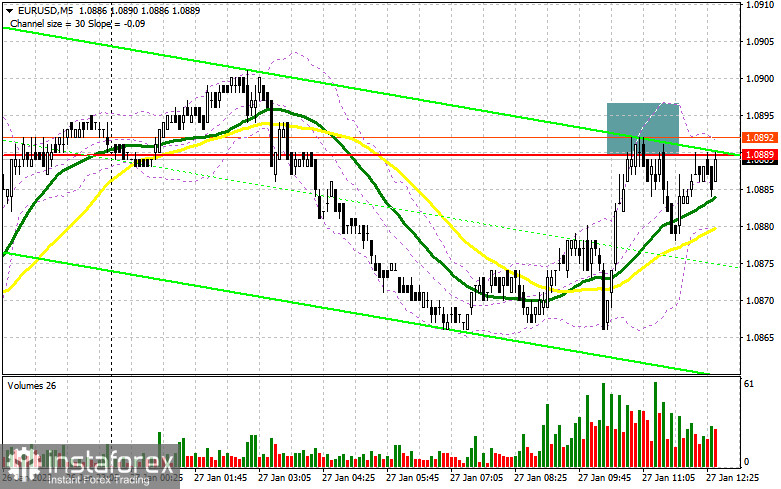
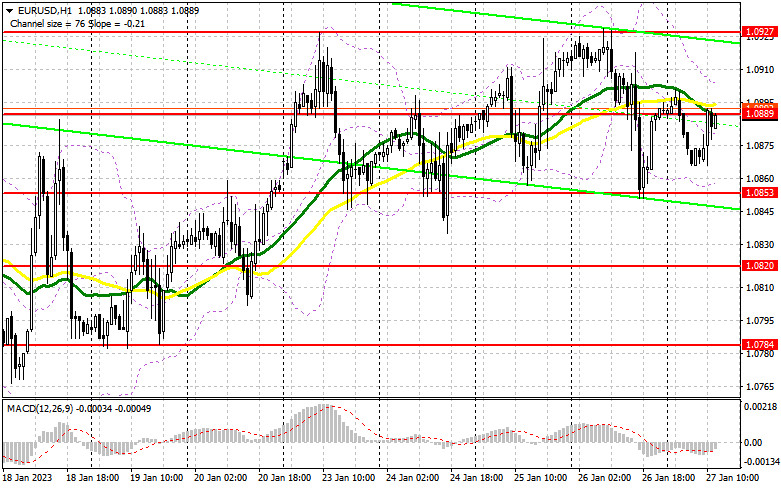
In my morning article, I turned your attention to 1.0889 and recommended making decisions with this level in focus. Now, let's look at the 5-minute chart and figure out what actually happened. The euro rose to 1.0889 against the background of the empty economic calendar. I mentioned such a possibility in my morning forecast. After that, a false breakout took place. However, the pair did not drop sharply. At the time of writing the article, the pair is trading around 1.0889 with a weak bearish momentum.
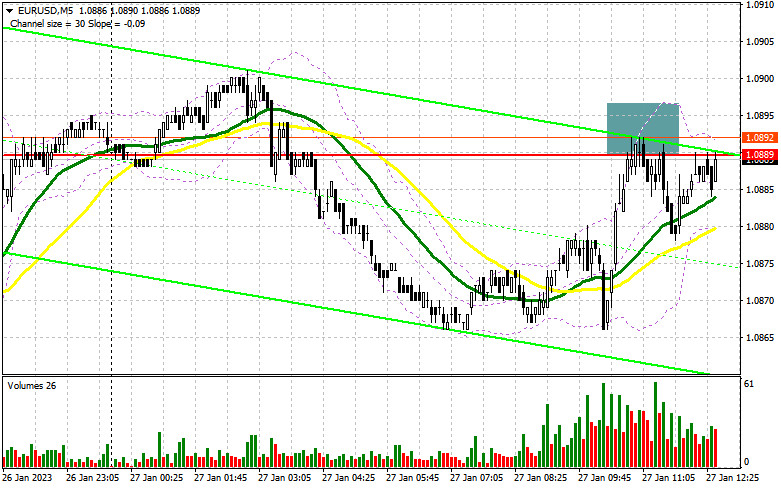
During the American session, the US will unveil crucial economic reports which may boost the US dollar against the euro. Yesterday, a similar situation occurred. The PCE Price Index and Household Income and Expenditure data are due today. A rise in these figures may affect market expectations of the Fed's rate decision. Notably, the regulator will announce its rate decision next week. The US dollar may assert strength, especially if the University of Michigan Consumer Sentiment Index also exceeds economists' forecasts. It is not surprising that my strategy is to buy the euro on declines. A false breakout of 1.0853 will give a buy signal. The pair is likely to climb rather quickly. The target level will be the morning resistance level of 1.0889. The pair failed to grow above this level. A breakout and a downward retest of this level could occur only amid weak US data. If so, the Fed is likely to raise rates less aggressively in the future. It may lead to a new buy signal with the prospect of a rise to 1.0927. A breakout of this level will also force the bears to close their Stop Loss orders, creating a buy signal with the possibility of an increase to 1.0969. At this level, I recommend locking in profits. If EUR/USD declines and buyers show no activity at 1.0853, or if there is no sharp growth from this level after a false breakout, I would advise you to close long positions. In this case, it is better to focus on the support level of 1.0820. Only a false breakout of this level will give a buy signal. You could buy EUR/USD at a bounce from a low of 1.0784 or 1.0735, keeping in mind an upward intraday correction of 30-35 pips.
When to open short positions on EUR/USD:
The bears managed to defend the 1.0889 level. However, it also did not cause a large downward movement. As long as trading is carried out below 1.0889, the euro may drop. Upbeat US reports could trigger a surge in market volatility. If so, it could stimulate an increase in the US dollar. Therefore, a breakout and a downward retest of 1.0853 will generate a sell signal with the aim of moving back to 1.0820. A drop below this level will cause a more significant correction to 1.0784, which will help the bears take the upper hand. At this level, I recommend locking in profits. If EUR/ USD moves up during the American session, it is better to open short positions at the resistance level of 1.0889, similar to the one I have mentioned above. A false breakout of this level will create an excellent sell signal. If the pair does not fall from 1.0889 in the afternoon and US data is disappointing, it would be wise to go short only at the resistance level of 1.0927 after a false breakout. You could sell EUR/USD at a bounce from a high of 1.0969, keeping in mind a downward intraday correction of 30-35 pips.
COT report
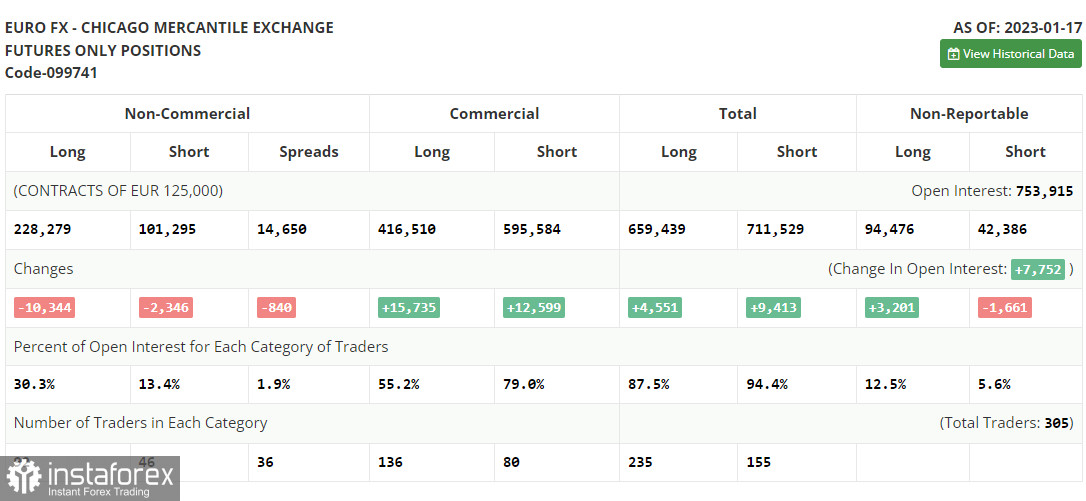
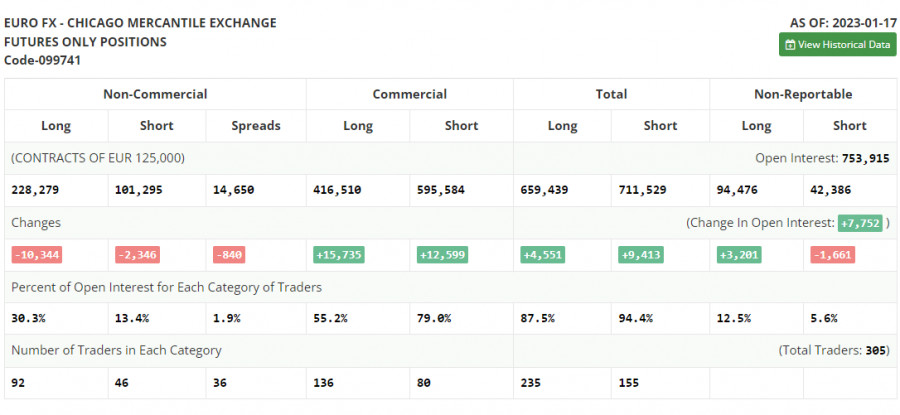
First of all, let us focus on the futures market and changes in the COT report. According to the COT report from January 17, the number of both long and short positions dropped. Traders took the wait-and-see approach after a rapid rise in the euro ahead of the Fed meeting that is scheduled for the next week. Quite weak fundamental data on the US economy, especially a decline in retail sales in December, pointed to the worsening of the overall situation in the country. It means that further monetary policy tightening may lead to even more negative results. On the other hand, inflation continues to slacken, thus allowing the Fed officials to revise the key interest rate hike. Meanwhile, the euro is supported by the ECB's officials who insist on a further key rate hike to combat inflation. Against the backdrop, the euro/dollar pair is reaching new local highs. The COT report unveiled that the number of long non-commercial positions declined by 10,344 to 228,279, while the number of short non-commercial positions slid by 2,346 to 101,295. At the end of the week, the total non-commercial net position decreased to 126,984 from 134,982. All this suggests that investors believe in further growth in the euro but they are still waiting for a clearer picture from central banks on future interest rates. The weekly closing price rose to 1.0833 against 1.0787.
Indicators' signals:
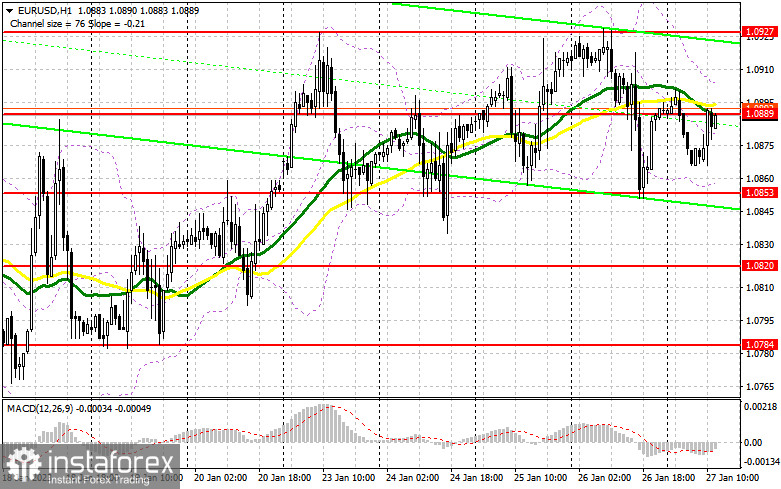
Trading is carried out near the 30 and 50 daily moving averages, which indicates market uncertainty.
Moving averages
Note: The period and prices of moving averages are considered by the author on the H1 (1-hour) chart and differ from the general definition of the classic daily moving averages on the daily D1 chart.
Bollinger Bands
If EUR/USD moves up, the indicator's upper border at 1.0900 will serve as resistance.
Description of indicators
- Moving average (moving average, determines the current trend by smoothing out volatility and noise). Period 50. It is marked yellow on the chart.
- Moving average (moving average, determines the current trend by smoothing out volatility and noise). Period 30. It is marked green on the chart.
- MACD indicator (Moving Average Convergence/Divergence - convergence/divergence of moving averages) Quick EMA period 12. Slow EMA period to 26. SMA period 9
- Bollinger Bands (Bollinger Bands). Period 20
- Non-commercial speculative traders, such as individual traders, hedge funds, and large institutions that use the futures market for speculative purposes and meet certain requirements.
- Long non-commercial positions represent the total long open position of non-commercial traders.
- Short non-commercial positions represent the total short open position of non-commercial traders.
- Total non-commercial net position is the difference between the short and long positions of non-commercial traders.