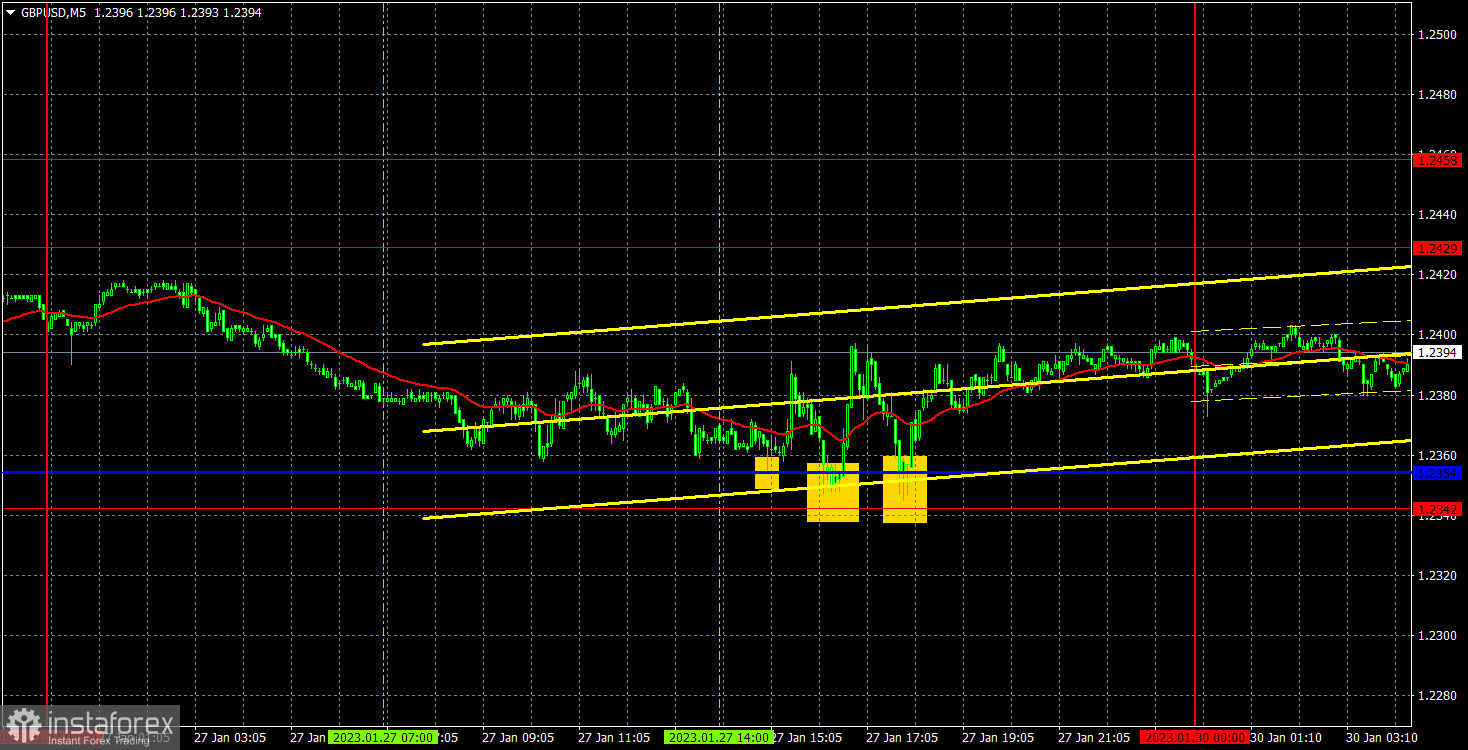
empty
30.01.2023 08:46 AM
GBP/USD: Forecast and trading signals on January 30, 2023. COT report. Detailed analysis of price movement and trades. Flat market on GBP/USD may continue this week

M5 chart of GBP/USD

This image is no longer relevant

On Friday, the GBP/USD pair traded sideways in the range between 1.2342 and 1.2429. Due to the lack of important macro releases during the day, we also saw no trend movements intraday. Overall, volatility totaled 70 pips. Clearly, the market started bracing for the new trading week already on Friday. Therefore, it traded so coolly. Let's hope this week does not disappoint. Its macroeconomic calendar will be empty on Monday and Tuesday but with some important events Wednesday through Friday. Therefore, the flat market is likely to continue at the beginning of the week. At this point, it remains to be seen whether the pair will be able to extend growth or a reversal will occur. A lot will depend on the Bank of England's interest rate decision and Governor Bailey's rhetoric. We are still expecting a bearish correction of 500 to 600 pips.

Three trading signals were made on Friday. During the day, the price hovered around the important line. Traders were lucky enough that the Kijun-sen was near the lower limit of the intraday range and not somewhere in the middle. We received a few buy signals, but the price failed to test the target level. Any trade closed either by Stop Loss at the breakeven point or with a small profit if closed manually.
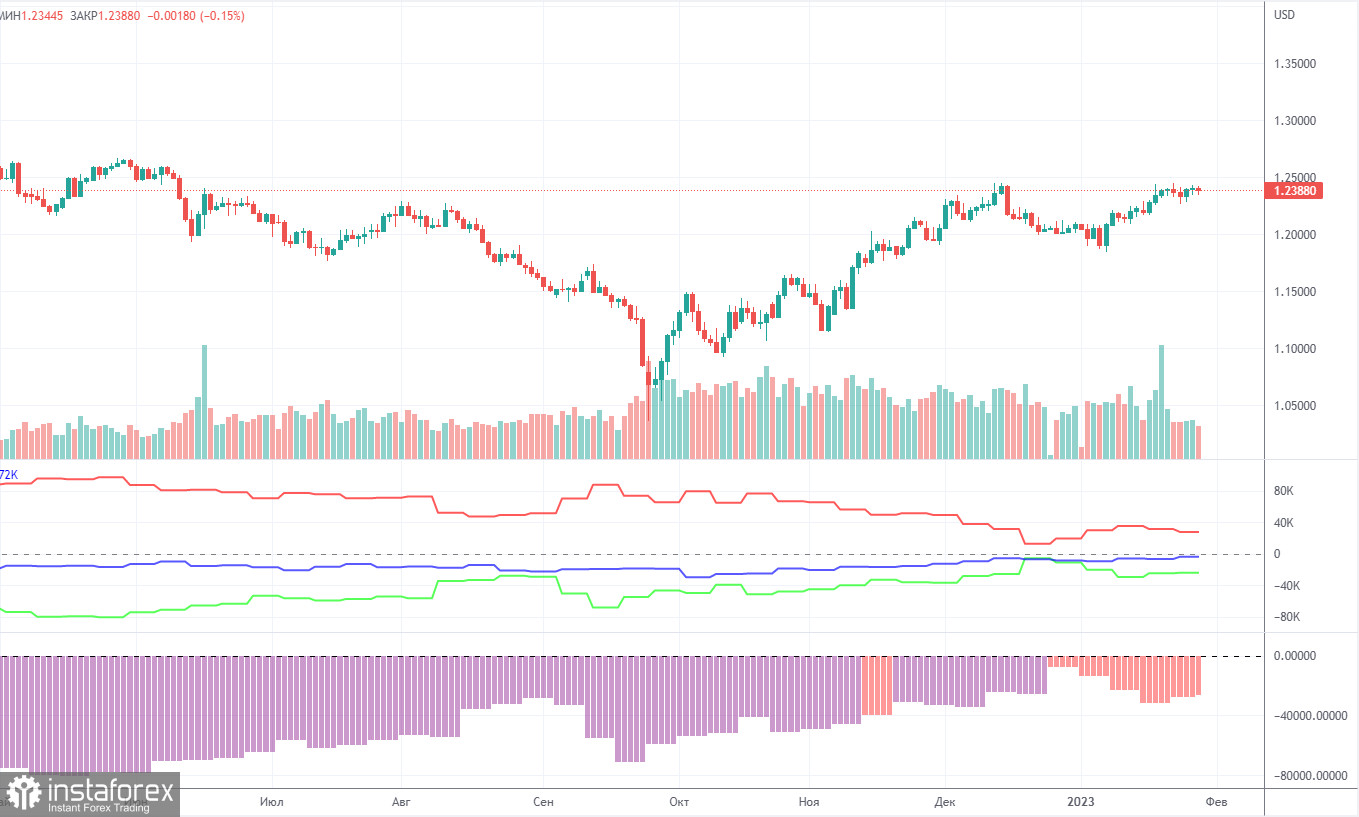
COT report:

This image is no longer relevant

The latest COT report showed a decrease in bearish sentiment. In a week, non-commercial traders closed 6,700 long positions and 7,500 short positions. The net non-commercial position grew by 800. The net non-commercial position has been on the rise in recent months. The sentiment of large traders may soon turn bullish. Although the pound sterling has been bullish against the greenback in recent months, its growth can hardly be explained with the help of fundamental analysis. We should not rule out the possibility that the pound may fall against the dollar in the medium term as a correction is needed. Overall, the latest COT reports have been in line with the pair's movement. Since the net position is not bullish yet, the buying spree may go on for several months more. Non-commercial traders now hold 35,000 long positions and 59,000 short ones. We are still skeptical about the pair being bullish in the long term although there are technical reasons for that. However, in terms of fundamentals and geopolitics, this will unlikely be a strong and fast uptrend.
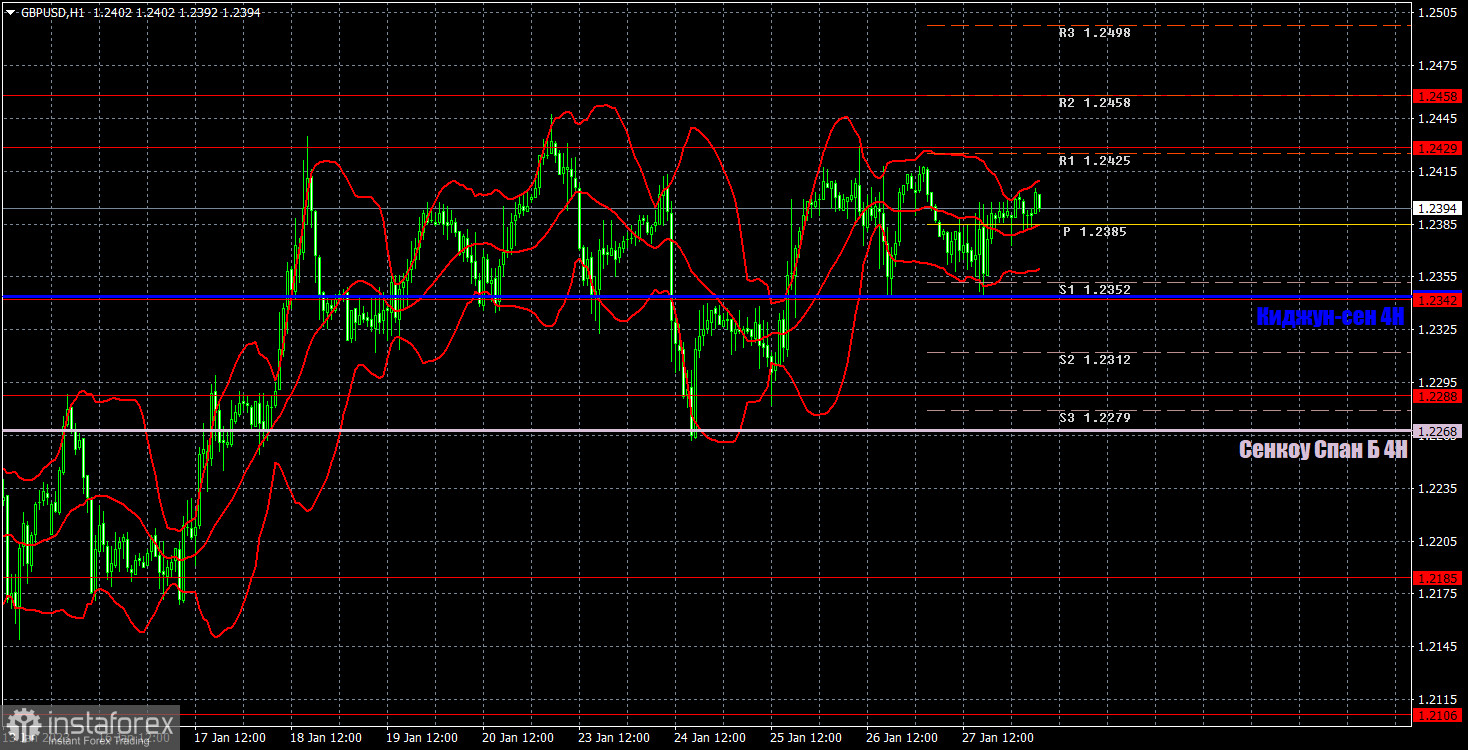
H1 chart of GBP/USD

This image is no longer relevant

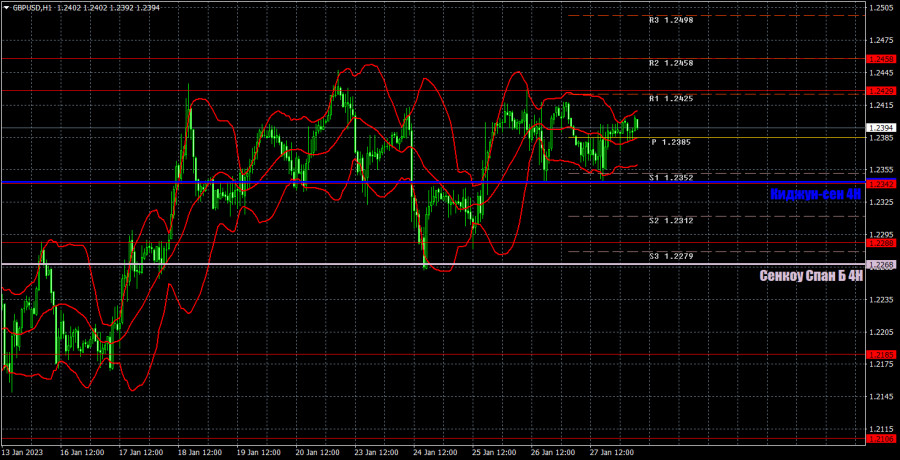
In the H1 time frame, GBP/USD is still moving in the sideways channel. Although the Ichimoku lines are not so strong now, we still marked their latest positions. That will prevent us from receiving multiple false signals around them. Expecting a downtrend, we are now waiting for the price to break both Ichimoku lines. However, in this case, US macro data should come upbeat and the Bank of England's decision should be dovish to the maximum. On January 18, important levels are seen at 1.2106, 1.2185, 1.2288, 1.2342, 1.2429-1.2458, 1.2589, 1.2659. Senkou Span B (1.2268) and Kijun-sen (1.2344) may also generate signals when the price either breaks or rebounds from these levels. Don't forget to place a stop-loss order at the breakeven point when the price passes 20 pips in the right direction. Ichimoku indicator lines can move during the day, which should be taken into account when determining trading signals. There are also support and resistance although no signals are made near these levels, which can be used for locking in profits. On Monday, due to the lack of macro events in the UK and the US, the flat market is likely to go on. The release of macro data and the meetings of central banks are to take place later during the week.

Indicators on charts:

Resistance/support - thick red lines, near which the trend may stop. They do not make trading signals.

The Kijun-sen and Senkou Span B lines are the Ichimoku indicator lines moved to the hourly timeframe from the 4-hour timeframe. They are also strong lines.

Extreme levels are thin red lines, from which the price used to bounce earlier. They can produce trading signals.

Yellow lines are trend lines, trend channels, and any other technical patterns.

Indicator 1 on the COT chart is the size of the net position of each trader category.

Indicator 2 on the COT chart is the size of the net position for the Non-commercial group of traders.

Paolo Greco,
Analytical expert of InstaForex
© 2007-2025
Select timeframe
5
min
15
min
30
min
1
hour
4
hours
1
day
1
week
Earn on cryptocurrency rate changes with InstaForex
Download MetaTrader 4 and open your first trade
  • Grand Choice
    Contest by
    InstaForex
    InstaForex always strives to help you
    fulfill your biggest dreams.
    JOIN CONTEST

Recommended Stories

How to Trade the GBP/USD Pair on May 23? Simple Tips and Trade Analysis for Beginners

Analysis of Thursday's Trades 1H Chart of GBP/USD The GBP/USD pair didn't even attempt a correction on Thursday. While the euro faced bearish pressure from weak business activity indices

Paolo Greco 05:58 2025-05-23 UTC+2

How to Trade the EUR/USD Pair on May 23? Simple Tips and Trade Analysis for Beginners

Analysis of Thursday's Trades 1H Chart of EUR/USD On Thursday, the EUR/USD currency pair corrected to the nearest support level on the hourly timeframe, which was at 1.1267. Multiple factors

Paolo Greco 05:57 2025-05-23 UTC+2

Trading Recommendations and Analysis for GBP/USD on May 23: Pound Prepares for a Historic Breakout

The GBP/USD currency pair broke out of its sideways channel through the upper boundary, but it is in no hurry to continue rising. Traders appear to be gathering momentum

Paolo Greco 03:43 2025-05-23 UTC+2

Trading Recommendations and Analysis for EUR/USD on May 23: The Euro Couldn't Withstand the Pressure

On Thursday, the EUR/USD currency pair traded lower, which can be considered an exception to the general trend. Nearly all macroeconomic reports during the day were unfavorable for the euro

Paolo Greco 03:43 2025-05-23 UTC+2

How to Trade the GBP/USD Pair on May 22? Simple Tips and Trade Analysis for Beginners

Analysis of Wednesday's Trades 1H Chart of GBP/USD The GBP/USD pair maintained its upward trend on Wednesday, a movement that has developed over the past two weeks. Recall that

Paolo Greco 06:31 2025-05-22 UTC+2

How to Trade the EUR/USD Pair on May 22? Simple Tips and Trade Analysis for Beginners

Analysis of Wednesday's Trades 1H Chart of EUR/USD On Wednesday, the EUR/USD currency pair continued its upward movement calmly and steadily. The price broke through the 1.1267 level, which

Paolo Greco 06:31 2025-05-22 UTC+2

Trading Recommendations and Analysis for GBP/USD on May 22: The Pound Breaks Through Key Levels

The GBP/USD currency pair also resumed its upward movement on Wednesday. The rise of the British pound, which in reality still reflects the fall of the US dollar, began overnight

Paolo Greco 03:30 2025-05-22 UTC+2

Trading Recommendations and Analysis for EUR/USD on May 22: Reasons Don't Matter and Aren't Needed

The EUR/USD currency pair resumed its upward movement on Wednesday, and it is now safe to say that the uptrend is present not only in the hourly timeframe but also

Paolo Greco 03:30 2025-05-22 UTC+2

How to Trade the GBP/USD Pair on May 21? Simple Tips and Trade Analysis for Beginners

Analysis of Tuesday's Trades 1H Chart of GBP/USD The GBP/USD pair mainly traded sideways on Tuesday, but early Wednesday morning it surged upward. On the 4-hour timeframe, it's clear that

Paolo Greco 06:17 2025-05-21 UTC+2

How to Trade the EUR/USD Pair on May 21? Simple Tips and Trade Analysis for Beginners

Analysis of Tuesday's Trades 1H Chart of EUR/USD On Tuesday, the EUR/USD currency pair traded sideways, but it resumed its upward movement early Wednesday morning. This indicates that the ongoing

Paolo Greco 06:17 2025-05-21 UTC+2
Can't speak right now?
Ask your question in the chat.
Widget callback
 

Dear visitor,

Your IP address shows that you are currently located in the USA. If you are a resident of the United States, you are prohibited from using the services of InstaFintech Group including online trading, online transfers, deposit/withdrawal of funds, etc.

If you think you are seeing this message by mistake and your location is not the US, kindly proceed to the website. Otherwise, you must leave the website in order to comply with government restrictions.

Why does your IP address show your location as the USA?

  • - you are using a VPN provided by a hosting company based in the United States;
  • - your IP does not have proper WHOIS records;
  • - an error occurred in the WHOIS geolocation database.

Please confirm whether you are a US resident or not by clicking the relevant button below. If you choose the wrong option, being a US resident, you will not be able to open an account with InstaForex anyway.

We are sorry for any inconvenience caused by this message.