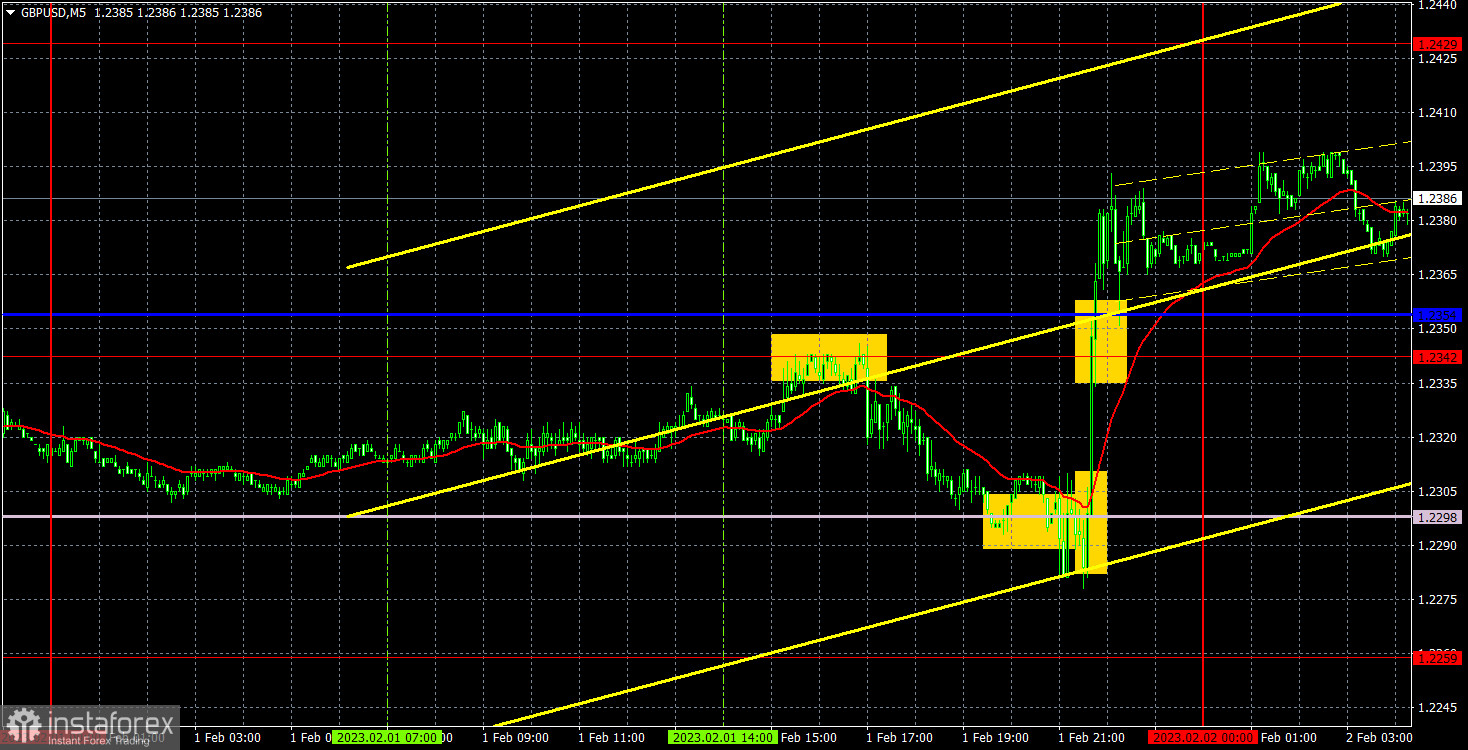
M5 chart of GBP/USD
GBP/USD also showed good growth, but failed to leave the horizontal channel bounded by the levels of 1.2288 and 1.2429. During the last few weeks, the pound was a bit more grounded than the euro and at least it was able to show a noticeable correction. The pound is also growing without a reason, but at least it corrects from time to time. Yesterday, the pound had exactly one less reason to show strong movement than the euro. The European Union published its inflation report, while there was no important data in the UK. And it doesn't matter that the EU inflation report was supposed to trigger the euro's fall, the market is inclined to buy anyway, that's why any event is interpreted against the dollar. You can find some dovish notes from Federal Reserve Chairman Jerome Powell's speech last night, if you want to. But then what is the point of analyzing his speech at all? Just to find dovish overtones and ignore all the hawkish statements? The hit parade of absurdity is just beginning, for today the results of the European Central Bank and Bank of England meetings will be announced.
The only trading signal that should have been worked out was the bounce from 1.2342 at the beginning of the US trading session. After that, the pair fell to the Senkou Span B line, and around the same time the results of the Fed meeting began to be summed up. The deal could be closed with the profit of about 25 pips. The pair even managed to settle below the Senkou Span B line and similarly to the euro, we could place a Stop Loss above this line and stay in the market. But the pair went upward, so the Stop Loss worked, and traders could earn the same 25 pips.
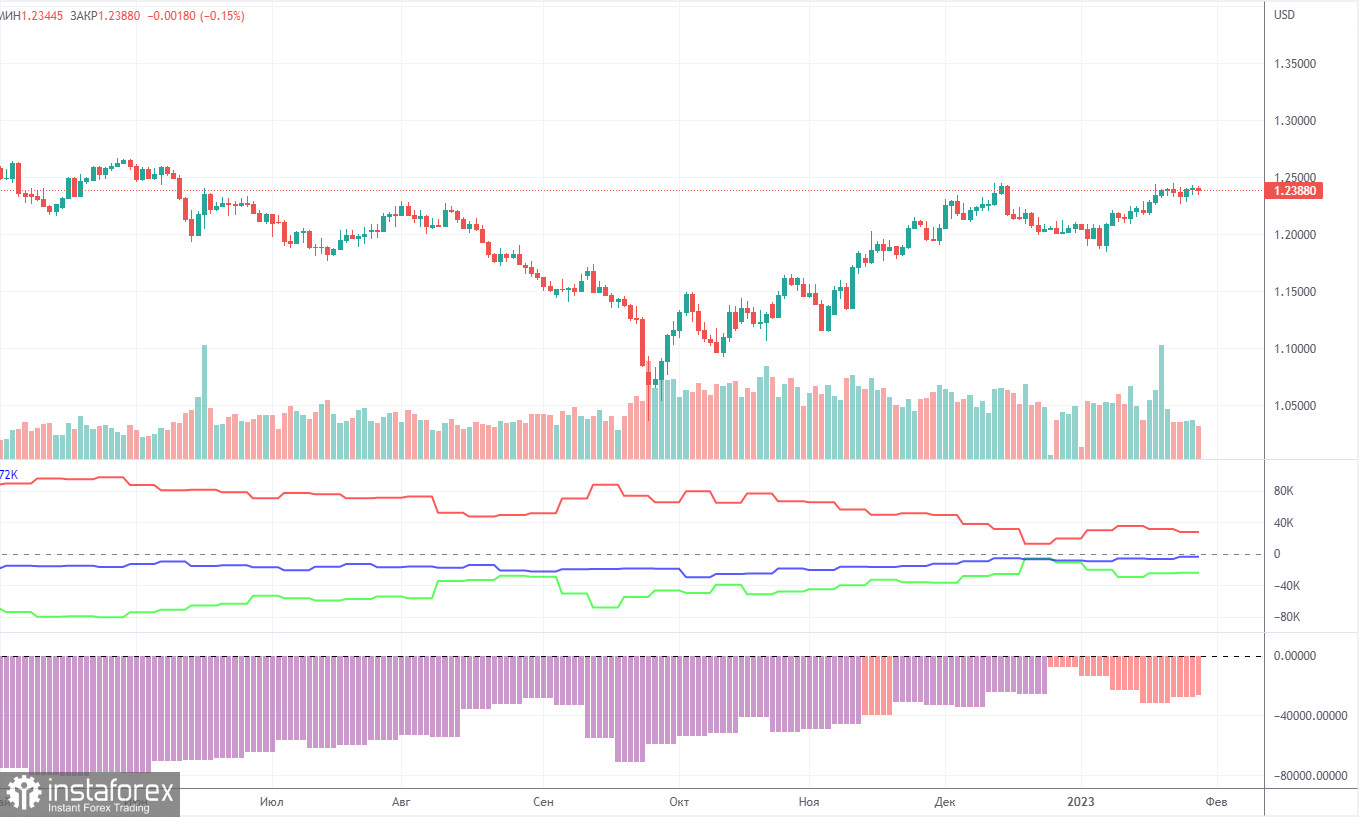
COT report
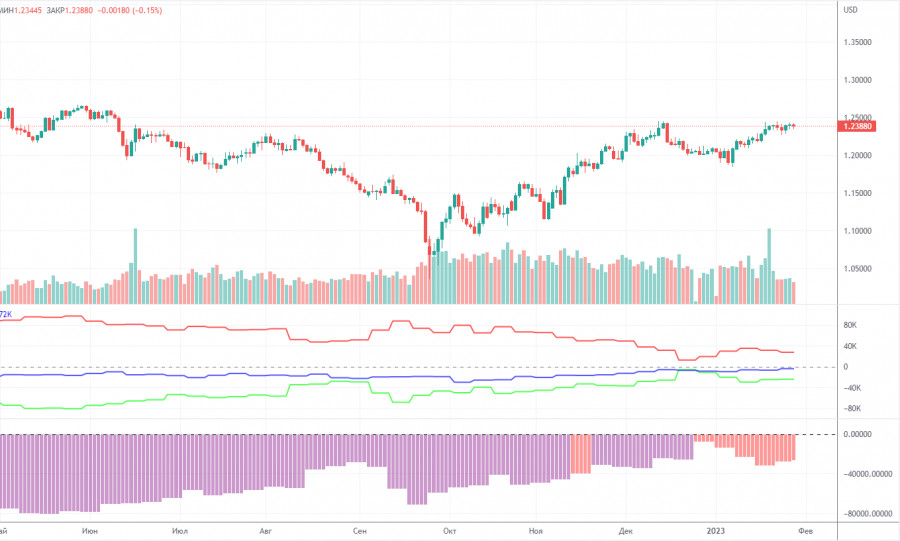
The latest COT report showed a decrease in bearish sentiment. In a week, non-commercial traders closed 6,700 long positions and 7,500 short positions. The net non-commercial position grew by 800. The net non-commercial position has been on the rise in recent months. The sentiment of large traders may soon turn bullish. Although the pound sterling has been bullish against the greenback in recent months, its growth can hardly be explained with the help of fundamental analysis. We should not rule out the possibility that the pound may fall against the dollar in the medium term as a correction is needed. Overall, the latest COT reports have been in line with the pair's movement. Since the net position is not bullish yet, the buying spree may go on for several months more. Non-commercial traders now hold 35,000 long positions and 59,000 short ones. We are still skeptical about the pair being bullish in the long term although there are technical reasons for that. However, in terms of fundamentals and geopolitics, this will unlikely be a strong and fast uptrend.
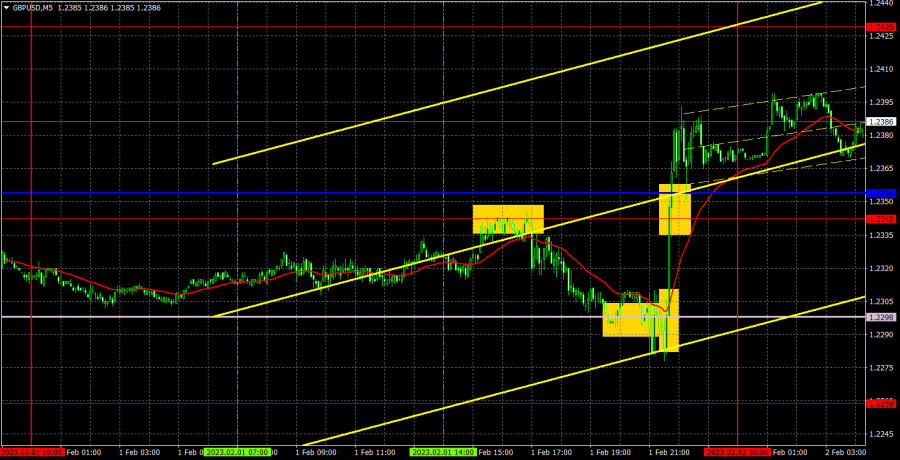
H1 chart of GBP/USD
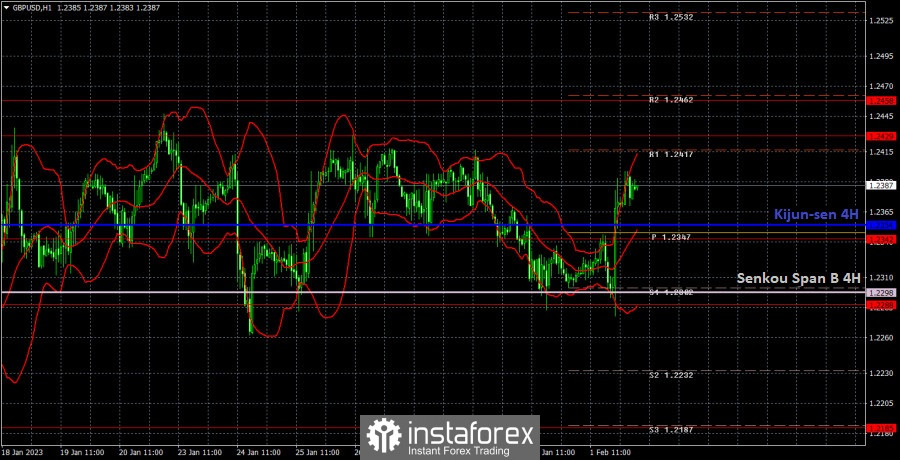
On the one-hour chart, GBP/USD continues to move in a sideways channel. This is obvious on any chart. The Fed meeting provoked an increase in volatility, but the movement still took place inside the sideways channel. Therefore, the technical picture has not changed at all. Today, everything will depend on the BoE, which is the "dark horse" for the traders. On February 2, the pair may trade at the following levels: 1.1974-1.2007, 1.2106, 1.2185, 1.2288, 1.2342, 1.2429-1.2458, 1.2589, 1.2659. The Senkou Span B (1.2298) and Kijun Sen (1.2354) lines may also generate signals. Pullbacks and breakouts through these lines may produce signals as well. A Stop Loss order should be set at the breakeven point after the price passes 20 pips in the right direction. Ichimoku indicator lines may move during the day, which should be taken into account when determining trading signals. In addition, the chart does illustrate support and resistance levels, which could be used to lock in profits. On Thursday, the results of the BoE's meeting will be announced and we also have BoE Governor Andrew Bailey's speech, which might provoke a new burst of activity on the market. There are only secondary reports in the US, which will be in the shadow of the two central bank meetings.
What we see on the trading charts:
Price levels of support and resistance are thick red lines, near which the movement may end. They do not provide trading signals.
The Kijun-sen and Senkou Span B lines are the lines of the Ichimoku indicator, moved to the one-hour chart from the 4-hour one. They are strong lines.
Extreme levels are thin red lines from which the price bounced earlier. They provide trading signals.
Yellow lines are trend lines, trend channels, and any other technical patterns.
Indicator 1 on the COT charts reflects the net position size of each category of traders.
Indicator 2 on the COT charts reflects the net position size for the non-commercial group.