empty
06.02.2023 08:49 AM
Outlook and trading signals for GBP/USD on February 6. COT report. USD determines its future

Analysis of GBP/USD, 5-minute chart
This image is no longer relevant

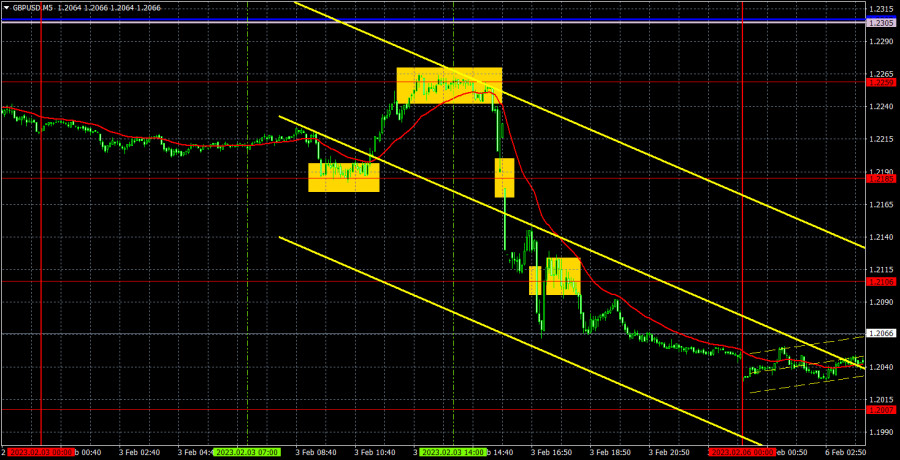
On Friday, the pound/dollar pair slumped. However, judging by the fundamental and macroeconomic data received last week, the situation could hardly be the opposite. Notably, the euro and the pound sterling were rising for a long time without obvious reasons. By the moment of central banks' meetings, both currencies were considerably overbought. Hawkish results of the meetings were priced in long ago. That is why the euro and British pound would have fallen in any case. Meanwhile, Friday's reports on the US unemployment rate, non-farm payrolls, and ISM PMI allowed the US dollar to increase. Now, the pound/dollar pair is likely to go on falling. The pound sterling has lost its upward momentum. The fundamental data is expected to worsen since the Bank of England may stop the monetary policy tightening at any moment. The key interest rate is likely to rise at a slower pace like in the US. Thus, there will be no reason for an increase in the British pound. Even if this assumption is false, there should be a downward correction.

On Friday, trading signals were quite good. At first, the pair rebounded from 1.2185 to 1.2259. Then, it bounced off 1.2259 to 1.2106. Using these two signals, traders might have earned about 180 pips. The signals formed later should have been ignored since they appeared too late.

COT report
This image is no longer relevant

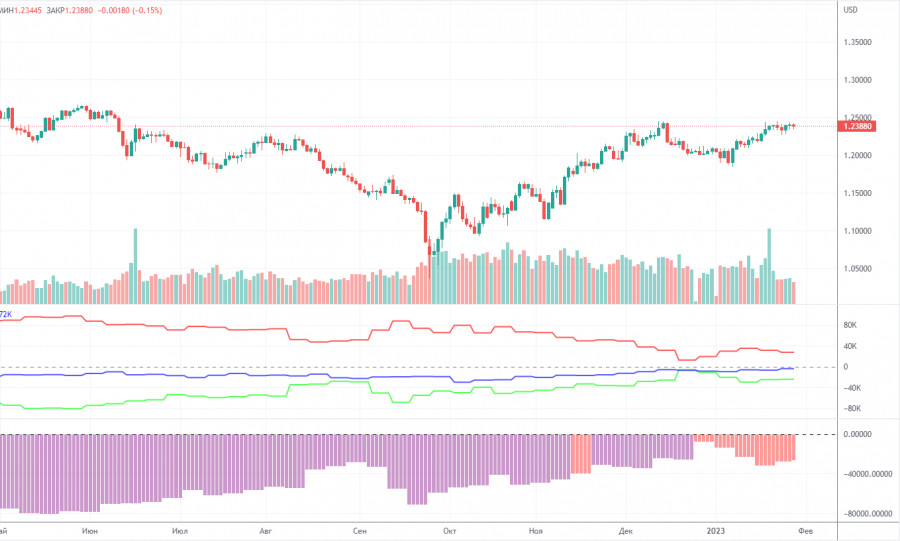
The recent COT report on the pound sterling unveiled that the bearish sentiment became weaker. During the week, non-commercial traders closed 6.7 thousand BUY contracts and 78.5 thousand SELL contracts. Thus, the net position of non-commercial traders increased by 0.8 thousand. During the last few months, the net position was increasing quite stably. The sentiment of big traders could become bullish in the near future. It is still very hard to explain why the pound sterling increased so much against the US dollar. In the mid-term, the British pound could drop as it needs correction. In general, the recent COT reports have been corresponding to the pound's movement. Since the net position is not bullish anymore, traders may buy the asset in the next few months. By the moment, non-commercial traders have opened 35 thousand buy positions and 59 thousand sell positions. We do not expect long-lasting growth in the pound sterling. Although it has technical reasons for that, the fundamental and geopolitical factors do not presuppose a strong and fast increase.

Analysis of GBP/USD, 1-hour chart
This image is no longer relevant

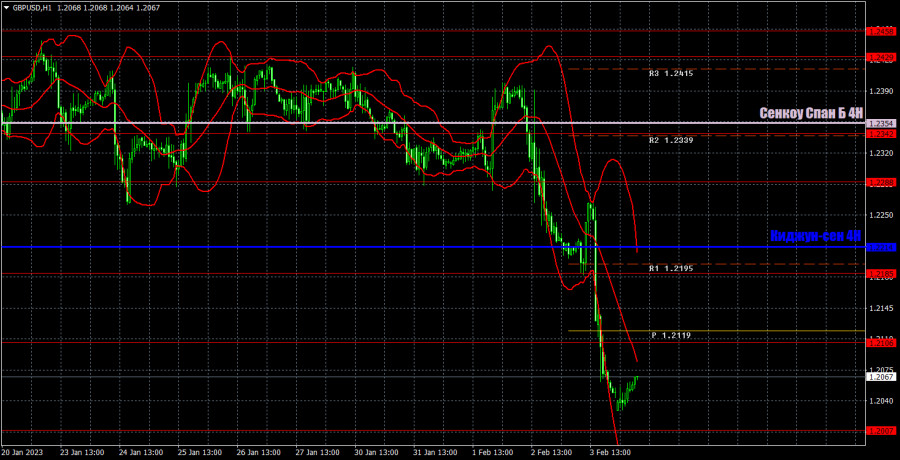
On the hourly chart, the pound/dollar pair left the sideways channel and showed signs of a downward movement in the short term. This week, the pair may climb slightly, whereas the volatility may drop since the fundamental and macroeconomic background will be weak. On February 6, there are the following important levels: 1.1874, 1.1974-1.2007, 1.2106, 1.2185, 1.2288, 1.2342 The Senkou Span B (1.2354) and Kijun-sen (1.2214) lines can also give signals. Rebounds and breakouts of these levels could also act as signals. It is recommended to place the stop loss level at the breakeven when the price covers 20 pips in the right direction. The lines of the Ichimoku indicator could move during the day, which should be taken into account when determining trading signals. There are also support and resistance levels that could be used to fix profits. On Monday, only construction PMI will be published in the UK, and nothing at all in the US. Nevertheless, the pair may show an inertial downward movement today as traders have not priced all the events of the last week. However, the volatility will become lower.

What we see on the trading charts:

Price levels of support and resistance are thick red lines, near which the movement may end. They do not provide trading signals.

The Kijun-sen and Senkou Span B lines are the lines of the Ichimoku indicator, moved to the one-hour chart from the 4-hour one. They are strong lines.

Extreme levels are thin red lines from which the price bounced earlier. They provide trading signals.

Yellow lines are trend lines, trend channels, and any other technical patterns.

Indicator 1 on the COT charts reflects the net position size of each category of traders.

Indicator 2 on the COT charts reflects the net position size for the non-commercial group.

Paolo Greco,
Analytical expert of InstaForex
© 2007-2025
Summary
Urgency
Analytic
Stanislav Polyanskiy
Start trade
Earn on cryptocurrency rate changes with InstaForex
Download MetaTrader 4 and open your first trade
  • Grand Choice
    Contest by
    InstaForex
    InstaForex always strives to help you
    fulfill your biggest dreams.
    JOIN CONTEST

Recommended Stories

How to Trade the GBP/USD Pair on August 13? Simple Tips and Trade Analysis for Beginners

Analysis of Tuesday's Trades 1H Chart of GBP/USD The GBP/USD pair also showed a relatively strong upward move, but unlike EUR/USD, it began rising from early morning. Data from

Paolo Greco 06:44 2025-08-13 UTC+2

How to Trade the EUR/USD Pair on August 13? Simple Tips and Trade Analysis for Beginners

Analysis of Tuesday's Trades 1H Chart of EUR/USD On Tuesday, the EUR/USD currency pair traded higher for a completely logical reason. The US Consumer Price Index showed a very unexpected

Paolo Greco 06:44 2025-08-13 UTC+2

Trading Recommendations and Trade Breakdown for GBP/USD on August 13 – The Pound Surprised Traders

The GBP/USD currency pair also traded higher on Tuesday, but this movement was driven not only by the U.S. inflation report but also by UK data. We cannot say that

Paolo Greco 03:49 2025-08-13 UTC+2

Trading Recommendations and Trade Breakdown for EUR/USD on August 13 – The Inflation Report Ruined Everything

The EUR/USD currency pair resumed its upward movement on Tuesday. This resumption was not without reason—it was entirely logical. While the market confidently ignored the morning European reports, it could

Paolo Greco 03:49 2025-08-13 UTC+2

How to Trade the GBP/USD Pair on August 12? Simple Tips and Trade Analysis for Beginners

Analysis of Monday's Trades 1H Chart of GBP/USD The GBP/USD pair also declined slightly on Monday, but the strengthening of the dollar means nothing. The price did not even manage

Paolo Greco 06:57 2025-08-12 UTC+2

How to Trade the EUR/USD Pair on August 12? Simple Tips and Trade Analysis for Beginners

Analysis of Monday's Trades 1H Chart of EUR/USD On Monday, the EUR/USD currency pair traded lower, despite the absence of any macroeconomic or fundamental reasons for such movement. However

Paolo Greco 06:57 2025-08-12 UTC+2

Trading Recommendations and Trade Breakdown for GBP/USD on August 12 – The Trend Remains

On Monday, the GBP/USD currency pair slightly declined toward the new ascending trendline, which in no way disrupted the current trend. Indeed, few expected the US currency to strengthen

Paolo Greco 03:32 2025-08-12 UTC+2

Trading Recommendations and Trade Breakdown for EUR/USD on August 12 – A Quiet Monday and Inflation

On Monday, the EUR/USD currency pair showed a downward movement but generally traded within roughly the same range as in recent days. The euro had been rising for a week

Paolo Greco 03:32 2025-08-12 UTC+2

How to Trade the GBP/USD Pair on August 11? Simple Tips and Trade Analysis for Beginners

Analysis of Friday's Trades 1H Chart of GBP/USD The GBP/USD pair continued its upward movement on Friday. The move was extremely weak, with the day's total volatility amounting to only

Paolo Greco 06:00 2025-08-11 UTC+2

How to Trade the EUR/USD Pair on August 11? Simple Tips and Trade Analysis for Beginners

Analysis of Friday's Trades 1H Chart of EUR/USD On Friday, the EUR/USD currency pair traded completely flat. No macroeconomic reports were scheduled for that day, so traders had nothing

Paolo Greco 06:00 2025-08-11 UTC+2
Can't speak right now?
Ask your question in the chat.
Widget callback
 

Dear visitor,

Your IP address shows that you are currently located in the USA. If you are a resident of the United States, you are prohibited from using the services of InstaFintech Group including online trading, online transfers, deposit/withdrawal of funds, etc.

If you think you are seeing this message by mistake and your location is not the US, kindly proceed to the website. Otherwise, you must leave the website in order to comply with government restrictions.

Why does your IP address show your location as the USA?

  • - you are using a VPN provided by a hosting company based in the United States;
  • - your IP does not have proper WHOIS records;
  • - an error occurred in the WHOIS geolocation database.

Please confirm whether you are a US resident or not by clicking the relevant button below. If you choose the wrong option, being a US resident, you will not be able to open an account with InstaForex anyway.

We are sorry for any inconvenience caused by this message.