On Friday, a few entry signals were made. Let's look at the M5 chart to get a picture of what happened. In the previous review, I focused on the 1.1935 level and considered entering the market there. A breakout and a downside test of this range generated a buy signal. The price went up by over 60 pips. In the North American session, a sell signal was made at 1.2003, and the quotes dropped by about 25 pips. A surge of GBP/USD produced a new sell signal after a bounce off 1.2099, bringing a profit of about 40 pips.
When to open long positions on GBP/USD:
In light of the latest data on the US jobs market, investors realized that the Federal Reserve would unlikely continue acting as aggressively as it used to. In other words, interest rates could hardly be raised by 0.50% at the March meeting. Meanwhile, the collapse of SVB fanned the flames. The Treasury Department, Federal Reserve, and Federal Deposit Insurance Corporation had to announce they would create a backstop for uninsured deposits at Silicon Valley Bank. Therefore, demand for the greenback will hardly be buoyant any time soon. Given that the macroeconomic calendar is empty today, it will be wiser to buy the pound on a fall and bet on the pair's further growth. In the case of the bearish GBP/USD quotes, only a false breakout through 1.2093 support will make a buy signal, targeting the February high of 1.2139. After consolidation and a downside test of this range, the price may head toward the 1.2177 high and then rise to 1.2220 where I am going to lock in profits. If the bulls lose grip on the 1.2093 mark, it will become possible to open long positions near 1.2055 support after a false breakout only. Likewise, GBP/USD could be bought on a bounce off the 1.2019 low, allowing a correction of 30 to 35 pips intraday.
When to open short positions on GBP/USD:
The trading plan in the European session will be to sell GBP/USD after a false breakout through 1.2139 resistance. In fact, the price failed to go above the barrier even in February. A sell signal will be made and the quotes will plunge to 1.2093 intermediate support. After a breakout and reversal retest to the upside, pressure on the pair will increase, targeting 1.2055. The most distant target is seen at the 1.2019 low where I am going to lock in profits. If GBP/USD goes up and there are no bears at 1.2139 in the wake of an empty macroeconomic calendar, the bears are likely to lose control of the market. A false breakout through 1.2177 resistance will create a sell entry point. If there is no trading activity there as well, I am going to sell GBP/USD from the 1.2220 high, allowing a bearish correction of 30 to 35 pips intraday.
COT report:
The COT report for February 7 logged a rise in both long and short positions. Apparently, traders welcome the BoE's further monetary policy plans which is why they opened new long positions. Yet, some market participants decided to sell a stronger pound, expecting the Fed to maintain its aggressive stance. This week, there will be just a few interesting reports in the economic calendar of the UK. It means that pressure on risk assets may finally ease, and a bullish correction may occur. Markets will definitely pay attention to Fed Chair Jerome Powell's remarks as markets brace for the regulator's next meeting in late March. According to the latest COT report, short non-commercial positions grew by 6,701 to 61,252, while long positions increased by 10,897 to 47,131. The non-commercial net position came in at -14,121 versus -18,317 a week ago. The weekly closing price fell to 1.2041 from 1.2333.
Indicator signals:
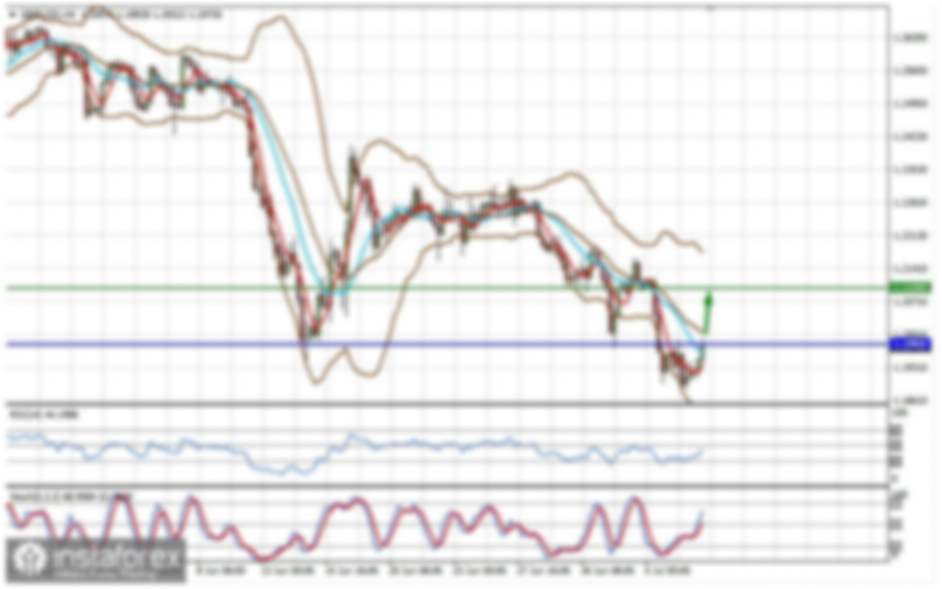
Moving averages
Trading is carried out slightly above the 30-day and 50-day moving averages, indicating a bullish continuation.
Note: The period and prices of moving averages are viewed by the author on the hourly chart and differ from the general definition of classic daily moving averages on the daily chart.
Bollinger Bands
Support stands at 1.1990, in line with the lower band.
Indicator description:
- Moving average (MA) determines the current trend by smoothing volatility and noise. Period 50. Colored yellow on the chart.
- Moving average (MA) determines the current trend by smoothing volatility and noise. Period 30. Colored green on the chart.
- Moving Average Convergence/Divergence (MACD). Fast EMA 12. Slow EMA 26. SMA 9.
- Bollinger Bands. Period 20
- Non-commercial traders are speculators such as individual traders, hedge funds, and large institutions who use the futures market for speculative purposes and meet certain requirements.
- Long non-commercial positions are the total long position of non-commercial traders.
- Non-commercial short positions are the total short position of non-commercial traders.
- Total non-commercial net position is the difference between the short and long positions of non-commercial traders.