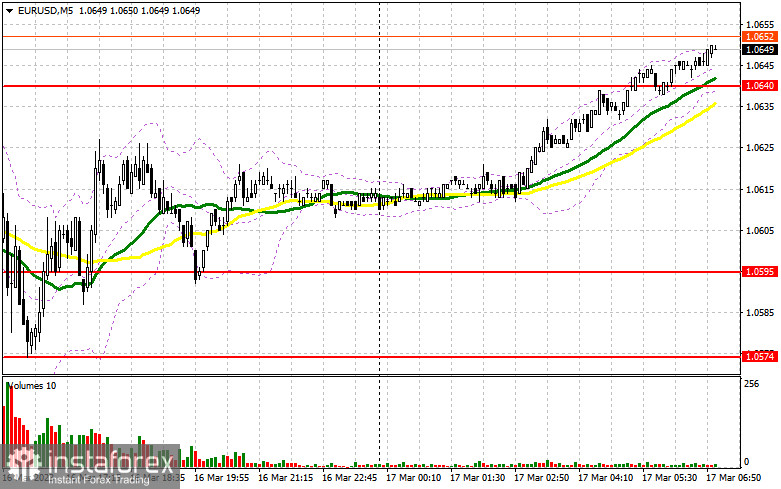
Yesterday there were no signals to enter the market. Let us take a look at the 5-minute chart to figure out what happened. Earlier, I asked you to pay attention to the level of 1.0614 to decide when to enter the market. A breakout occurred without any reverse test, so there were no good signals from that level. In the second part of the day, there were no good signals either.
Conditions for opening long positions on EUR/USD:
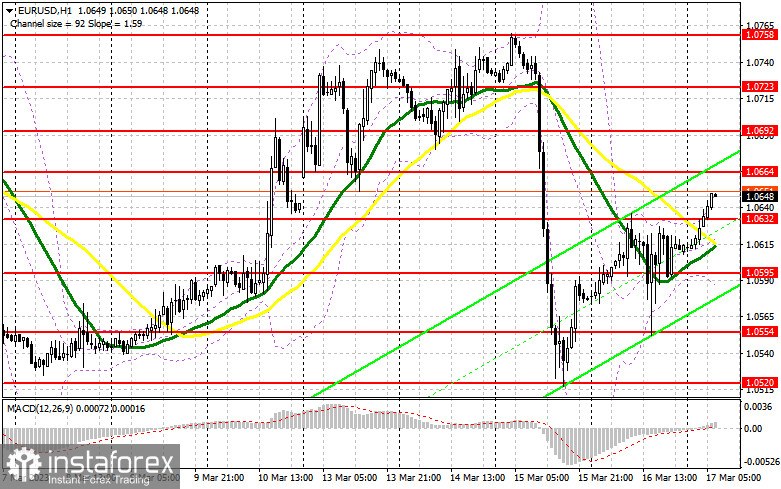
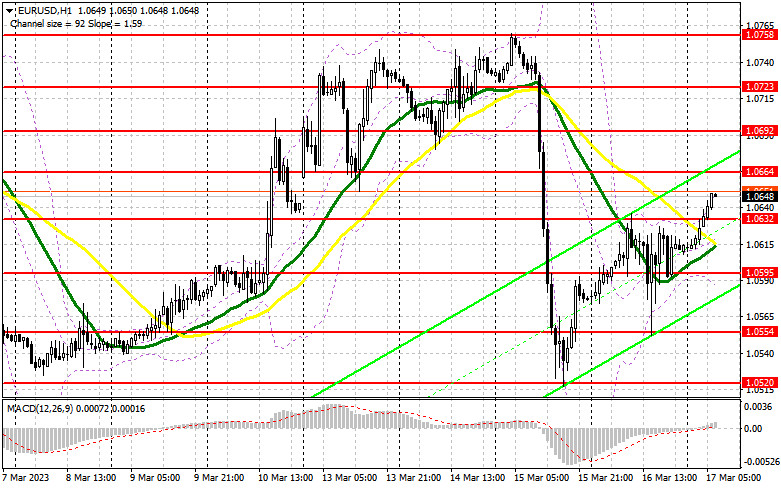
Today, traders will focus on the eurozone inflation report, which may continue to rise in February. Core inflation will be the main focus, which the European Central Bank is putting special emphasis on. If it grows the Bank will continue to aggressively lift rates, which was announced yesterday. On Thursday, rates were raised immediately by 0.5%. This was one of the reasons why the euro grew. In the first part of the day, in case the euro is under pressure if we receive a weak inflation report, we should focus on the nearest support level at 1.0632. A false breakout through the barrier will create a buy entry point with the target at 1.0664. An additional buy entry point will form if the price breaks and tests this mark to the upside. The target is seen at 1.0692. A breakout through it will trigger a row of bearish stop orders and make an additional signal with the target at 1.0723, where I am going to lock in profits. However, this will only be possible if eurozone inflation sharply rises in February. If EUR/USD goes down and there is no bullish activity at 1.0632, which is likely, the market will enter a correction, and the pressure on the pair will increase. A breakout through the level will cause a fall to the support level of 1.0595. Only a false breakout through it will generate a buy signal. The trading plan will also be to buy around 1.0554, or even lower, around 1.0520, allowing a bullish correction of 30 to 35 pips intraday.
Conditions for opening short positions on EUR/USD:
The bears suffered another fiasco yesterday, although after the ECB announced its decision they tried to return to a one-month low. Now the bears should protect the nearest resistance level of 1.0664, which could be tested in the European session. The trading plan will be to sell after a false breakout, targeting the nearest support level of 1.0664, which will pull down the euro to the nearest support at 1.0632, which is slightly below the bullish moving averages. A breakout and a reverse test of this range may trigger a correction with an additional signal to sell at 1.0595. Consolidation below this range after the release of the eurozone inflation report will lead to a steep fall to 1.0554 where I am going to lock in profits. In case of growth in EUR/USD in the European session and the absence of the bears at 1.0664. The trading plan will be to open short positions after a false breakout at 1.0692. On a rebound, EUR/USD could be sold at the 1.0723 high, allowing a bearish correction of 30 to 35 pips intraday.
COT report:
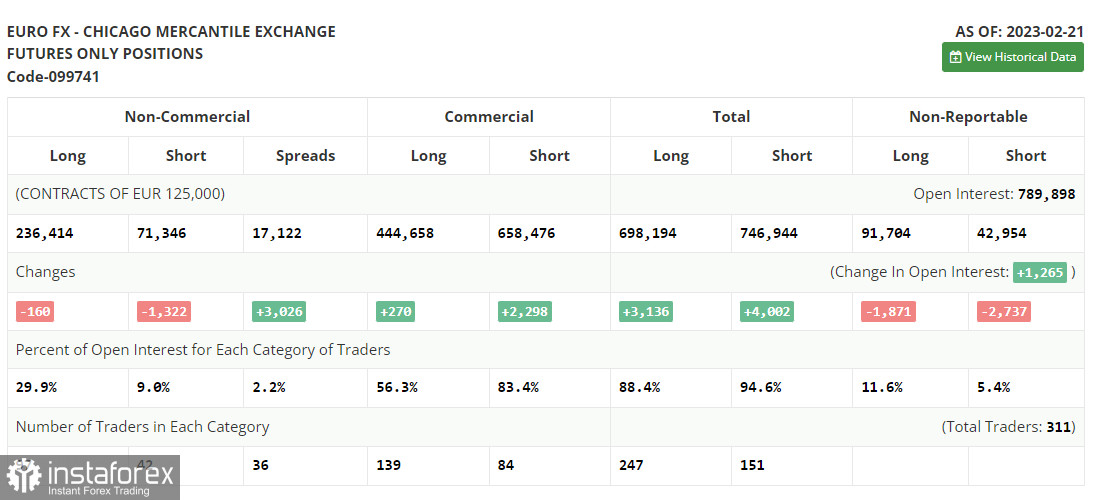
The COT report for February 21 logged a decrease in both long and short positions. In fact, the COT data from a month ago is of little interest at this point as it is not relevant due to the technical glitch the CFTC recently suffered. Waiting for fresh reports is all that's left. One of the main events of the week will be US inflation, which may persuade traders that the Fed will unlikely continue its aggressive stance on monetary policy. The SVB meltdown and risks of a collapse in the US banking sector will surely change the Fed's stance on rate hikes. According to the COT report, long non-commercial positions decreased by 160 to 236,414. Short non-commercial positions dropped by 1,322 to 71,346. The non-commercial net position came in at 165,038 versus 150,509. The weekly closing price fell to 1.0698 from 1.0742.
Signals of indicators:
Moving Averages
Trading is performed below the 30- and 50-day moving averages, which indicates that the bulls are trying to get back into the market.
Note: The author considers the period and prices of moving averages on the one-hour chart which differs from the general definition of the classic daily moving averages on the daily chart.
Bollinger Bands
In case of a decline, the lower limit of the indicator located around 1.0575 will act as support.
Description of indicators
- Moving average (a moving average determines the current trend by smoothing volatility and noise). The period is 50. It is marked in yellow on the chart.
- Moving average (a moving average determines the current trend by smoothing volatility and noise). The period is 30. It is marked in green on the graph.
- MACD indicator (Moving Average Convergence/Divergence - convergence/divergence of moving averages). A fast EMA period is 12. A slow EMA period is 26. The SMA period is 9.
- Bollinger Bands. The period is 20.
- Non-profit speculative traders are individual traders, hedge funds, and large institutions that use the futures market for speculative purposes and meet certain requirements.
- Long non-commercial positions are the total number of long positions opened by non-commercial traders.
- Short non-commercial positions are the total number of short positions opened by non-commercial traders.
- The total non-commercial net position is a difference in the number of short and long positions opened by non-commercial traders.