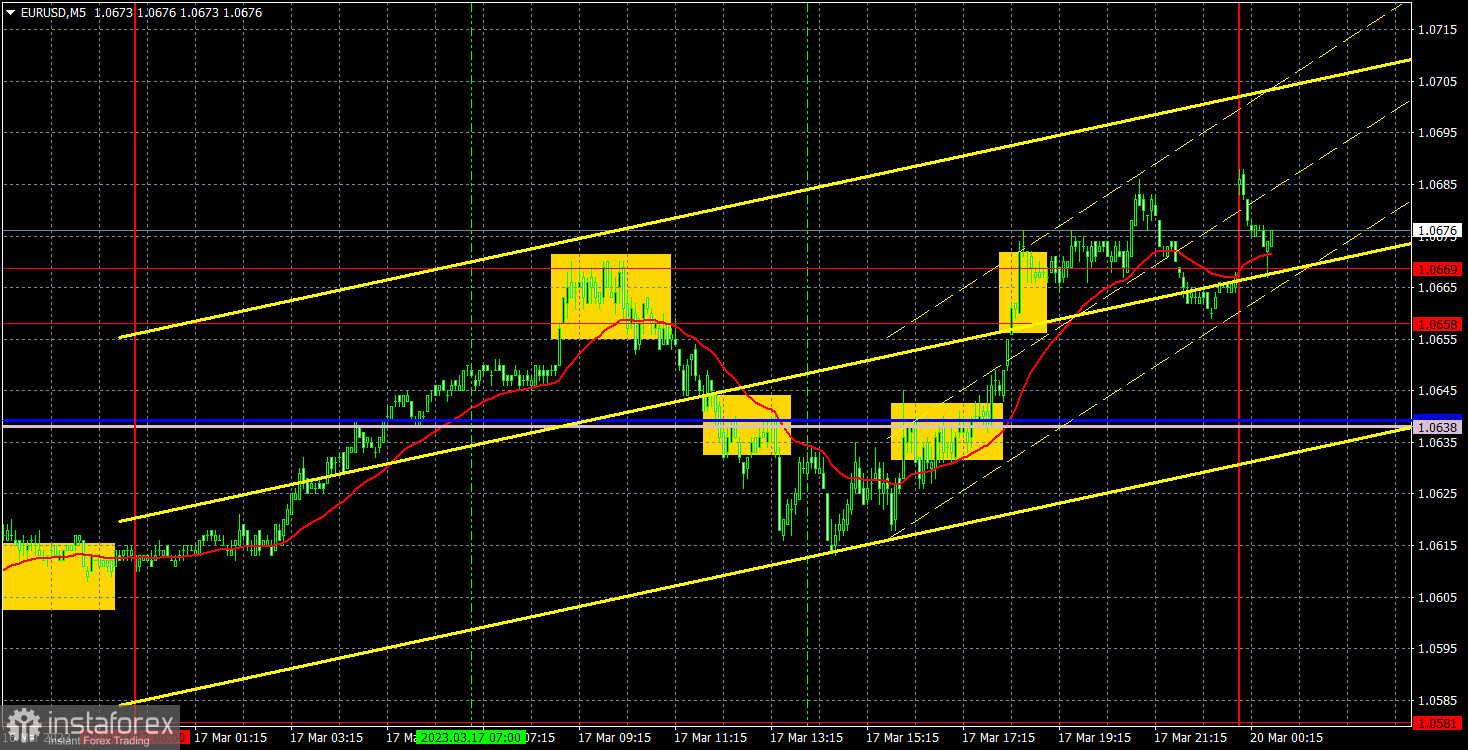
empty
20.03.2023 05:19 AM
EUR/USD: Forecast and trading signals on March 20. COT report. Detailed analysis of price movement and trades. A roller coaster within the day.

5M chart of EUR/USD

This image is no longer relevant

On Friday, EUR/USD managed to both fall and rise. Despite the fact that there were several important reports during the day, I don't think they provoked the movements everyone eventually saw. The euro was falling even before the inflation report, which objectively can be called neither positive, nor negative. The US data was of even less use, as it was far from being the most important and significant. In general, it could have a bit of an influence on traders' mood, but not a strong one. The pair continues to trade very chaotically. Not even on the 5-minute chart, and not on the hourly one as well. It's about the higher charts. But this turmoil is also carried over to the lower charts. So, now we can expect practically any movement on any chart.

There were four trading signals on Friday. First a rebound from the area of 1.0658-1.0669, then overcoming the Senkou Span B and Kijun-Sen lines and then two reverse signals. As a result, traders could open two positions, each of which brought a small profit. A very small profit. But better a small profit than a loss or no profit at all. Thus, it was possible to earn even if it wasn't the best movements. Friday movements were not very bad, at least the pair did not stand in one place and did not build "fences".
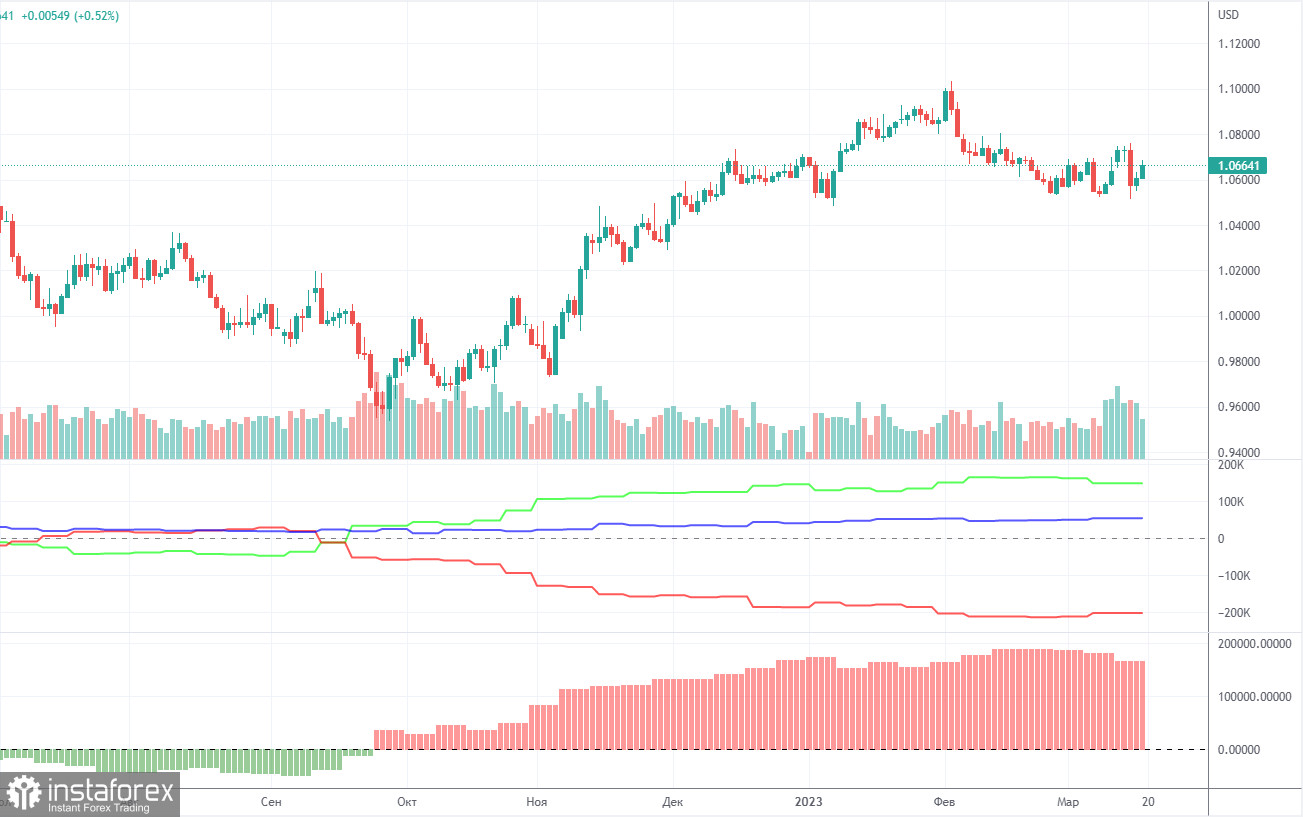
COT report:

This image is no longer relevant

On Friday, the new COT report for March 7 was released. The Commodity Futures Trading Commission is slowly catching up with the lost time and publishes reports that have a frequency of two weeks. At this rate, in a couple of weeks we will get the actual data again. So far, we can say that in the last few months, the overall picture has been corresponding to the market situation. On the chart above, we see that the net non-commercial position of large traders (second indicator) has risen since September 2022. At about the same time, the euro started to rise. The net non-commercial position is bullish and only started to fall during the last couple of weeks, which coincides with the euro's decline. I have already drawn your attention to the fact that a fairly high value of the "net position" allows us to expect the uptrend to stop shortly. Such a signal comes from the first indicator, with the green line and the red line being far apart, which is usually a sign of the end of a trend. The euro has already started to fall, but we don't know if it's just a bearish correction or a new downtrend. According to the latest report, non-commercial traders closed 6,900 long positions, while the number of short ones increased by 6,900. Consequently, the net position fell by 13,800. The number of long positions exceeds that of short ones by 148,000. In any case, a correction has been looming for a long time. Therefore, even without reports, it is clear that the downtrend will continue.
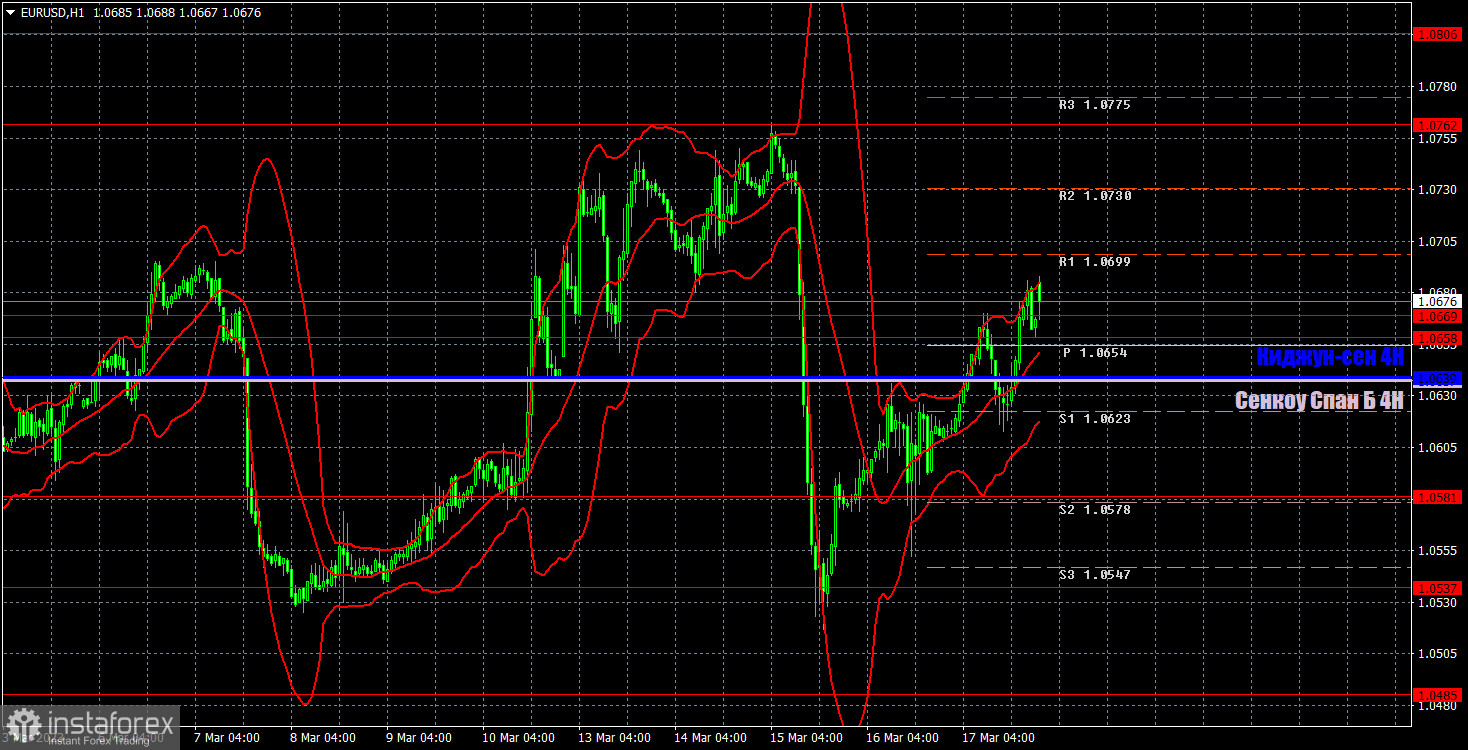
1H chart of EUR/USD

This image is no longer relevant

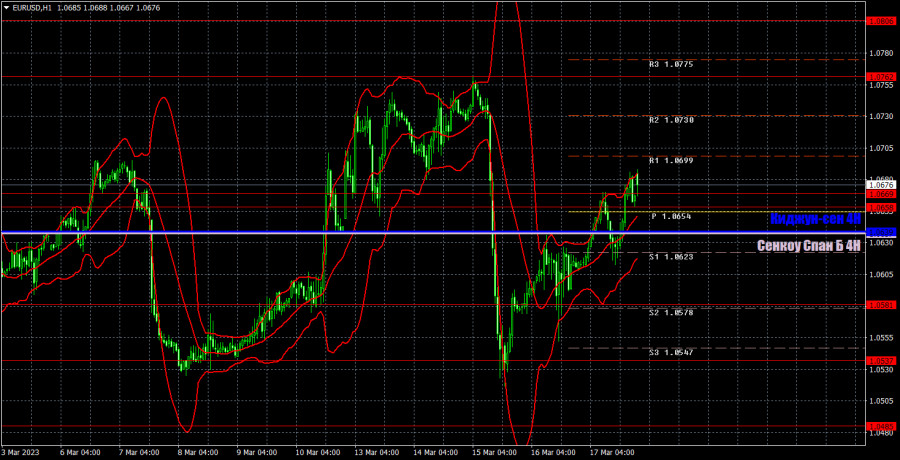
On the one-hour chart, EUR/USD continues to trade in a "swing" mode with all the ensuing consequences. The Kijun-Sen and Senkou-Span B lines have merged, which is the best evidence of a flat. Therefore, when you open any positions using any signals you should consider not only the flat, but also the swing. On Monday, important levels are seen at 1.0340-1.0366, 1.0485, 1.0537, 1.0581, 1.0658-1.0669, 1.0762, 1.0806, 1.0868, as well as Senkou Span B (1.0637) and Kijun Sen (1.0639) lines. Ichimoku indicator lines can move intraday, which should be taken into account when determining trading signals. There are also support and resistance although no signals are made near these levels. They could be made when the price either breaks or rebounds from these extreme levels. Do not forget to place Stop Loss at the breakeven point when the price goes by 15 pips in the right direction. In case of a false breakout, it could save you from possible losses. On March 20, European Central Bank President Christine Lagarde will give two speeches in the European Union. These are potentially important events, but Lagarde can talk about anything but monetary policy. Or she may have nothing new to say on issues that traders find interesting.

Indicators on charts:

Resistance/support - thick red lines, near which the trend may stop. They do not make trading signals.

Kijun-sen and Senkou Span B are the Ichimoku indicator lines moved to the hourly timeframe from the 4-hour timeframe. They are also strong lines.

Extreme levels are thin red lines, from which the price used to bounce earlier. They can produce trading signals.

Yellow lines are trend lines, trend channels, and any other technical patterns.

Indicator 1 on the COT chart is the size of the net position of each trader category.

Indicator 2 on the COT chart is the size of the net position for the Non-commercial group of traders.

Paolo Greco,
Analytical expert of InstaForex
© 2007-2025
Select timeframe
5
min
15
min
30
min
1
hour
4
hours
1
day
1
week
Earn on cryptocurrency rate changes with InstaForex
Download MetaTrader 4 and open your first trade
  • Grand Choice
    Contest by
    InstaForex
    InstaForex always strives to help you
    fulfill your biggest dreams.
    JOIN CONTEST

Recommended Stories

GBP/USD: Trading Plan for the U.S. Session on May 28th (Review of Morning Trades)

In my morning forecast, I highlighted the 1.3497 level and planned to base entry decisions on it. Let's look at the 5-minute chart and see what happened. A rise

Miroslaw Bawulski 18:31 2025-05-28 UTC+2

EUR/USD: Trading Plan for the U.S. Session on May 28th (Review of Morning Trades)

In my morning forecast, I highlighted the 1.1300 level and planned to base my entry decisions around it. Let's take a look at the 5-minute chart to see what happened

Miroslaw Bawulski 18:27 2025-05-28 UTC+2

How to Trade the GBP/USD Pair on May 28? Simple Tips and Trade Analysis for Beginners

Analysis of Tuesday's Trades 1H Chart of GBP/USD On Tuesday, the GBP/USD pair also traded lower for the same reasons as the EUR/USD pair. First, after a conversation with Ursula

Paolo Greco 06:41 2025-05-28 UTC+2

How to Trade the EUR/USD Pair on May 28? Simple Tips and Trade Analysis for Beginners

Analysis of Tuesday's Trades 1H Chart of EUR/USD On Tuesday, the EUR/USD currency pair continued its downward movement, which had begun on Monday. The dollar continued to strengthen the night

Paolo Greco 06:41 2025-05-28 UTC+2

Trading Recommendations and Analysis for GBP/USD on May 28: A Minor Correction Won't Hurt

On Tuesday, the GBP/USD currency pair also traded lower for the same reasons as the EUR/USD pair. However, it cannot be said that the British currency depreciated significantly—an upward movement

Paolo Greco 04:10 2025-05-28 UTC+2

Trading Recommendations and Analysis for EUR/USD on May 28: The Dollar's Joy May Be Short-Lived

The EUR/USD currency pair showed a somewhat significant downward movement on Tuesday. However, this move did not impact the overall trend, market sentiment, or the broader context. The strengthening

Paolo Greco 04:10 2025-05-28 UTC+2

GBP/USD: Trading Plan for the U.S. Session on May 27th (Review of Morning Trades)

In my morning forecast, I highlighted the 1.3545 level and planned to make trading decisions based on it. Let's look at the 5-minute chart and see what happened. A decline

Miroslaw Bawulski 20:13 2025-05-27 UTC+2

EUR/USD: Trading Plan for the U.S. Session on May 27th (Review of the Morning Trades)

In my morning forecast, I highlighted the 1.1374 level and planned to make trading decisions based on it. Let's look at the 5-minute chart to analyze what happened. A decline

Miroslaw Bawulski 20:07 2025-05-27 UTC+2

How to Trade the GBP/USD Pair on May 27? Simple Tips and Trade Analysis for Beginners

Analysis of Monday's Trades 1H Chart of GBP/USD On Monday, the GBP/USD pair reached 1.3580 — heights the British pound hadn't seen in over three years. As we've said

Paolo Greco 07:04 2025-05-27 UTC+2

How to Trade the EUR/USD Pair on May 27? Simple Tips and Trade Analysis for Beginners

Analysis of Monday's Trades 1H Chart of EUR/USD The EUR/USD currency pair continued its upward movement on Monday, which had started back on Friday. Only in the second half

Paolo Greco 07:04 2025-05-27 UTC+2
Can't speak right now?
Ask your question in the chat.
Widget callback
 

Dear visitor,

Your IP address shows that you are currently located in the USA. If you are a resident of the United States, you are prohibited from using the services of InstaFintech Group including online trading, online transfers, deposit/withdrawal of funds, etc.

If you think you are seeing this message by mistake and your location is not the US, kindly proceed to the website. Otherwise, you must leave the website in order to comply with government restrictions.

Why does your IP address show your location as the USA?

  • - you are using a VPN provided by a hosting company based in the United States;
  • - your IP does not have proper WHOIS records;
  • - an error occurred in the WHOIS geolocation database.

Please confirm whether you are a US resident or not by clicking the relevant button below. If you choose the wrong option, being a US resident, you will not be able to open an account with InstaForex anyway.

We are sorry for any inconvenience caused by this message.