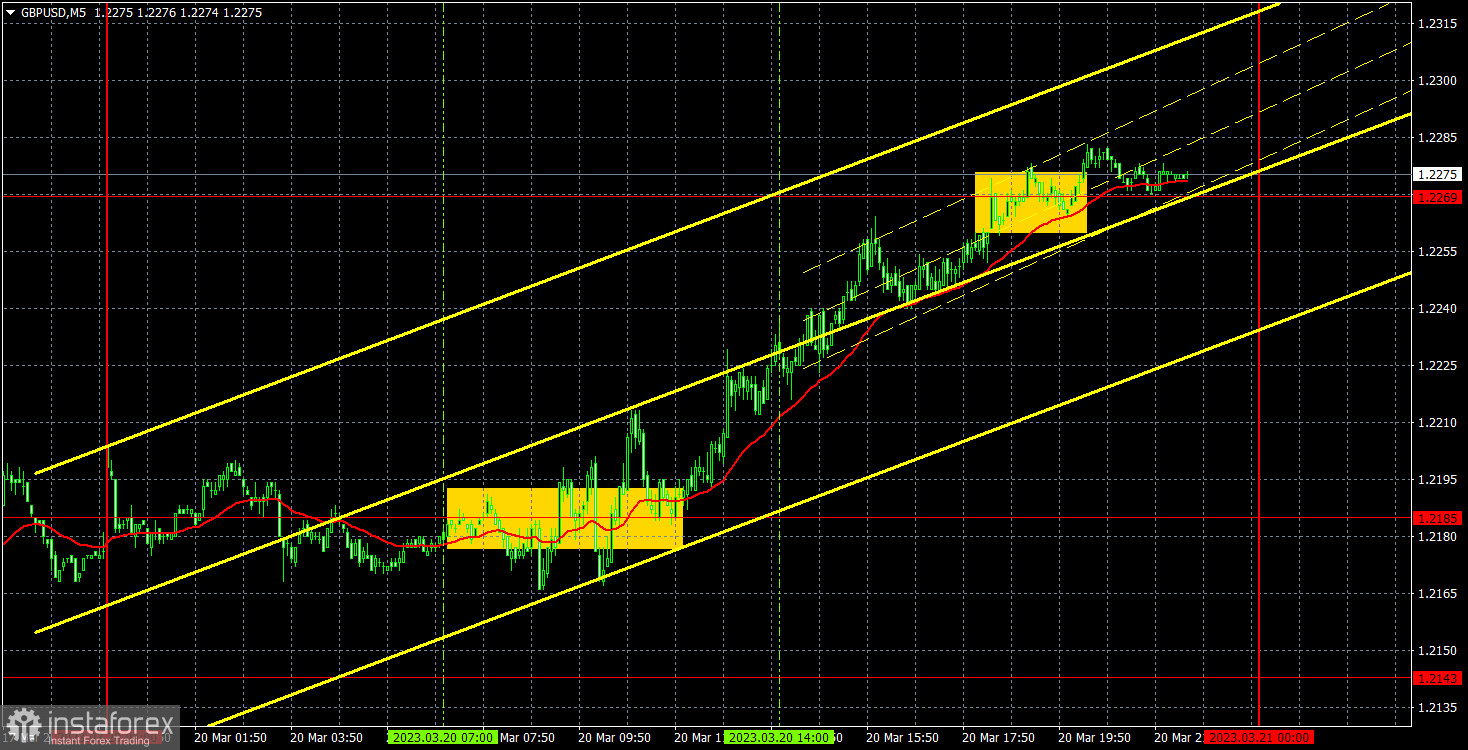
empty
21.03.2023 07:55 AM
GBP/USD: Forecast and trading signals on March 21. COT report. Detailed analysis of price movement and trades. The pound is rising again. The reasons are technical

5M chart of GBP/USD

This image is no longer relevant

On Monday, GBP/USD followed the EUR/USD pair. In terms of "technique", such a movement was quite logical, because there is still a flat and "swing" on the higher charts. Therefore, the pair does not need the appropriate factors to exhibit the movement in one direction or the other. The pound may easily go up another 200-250 pips and appear near the upper limit of the horizontal channel in the daily chart. And on the lower chart, GBP can climb 500-600 points, which seems to be a strong trend. That is why yesterday we didn't even need any basis for such a movement. There were none. Technically, the euro could pull the pound up, but its grounds for its own growth were also questionable. Anyway, please remember that we can also observe a swing movement.

Speaking of trading signals, they weren't quite clear. Initially, the pound sharply rose several times and settled above and below 1.2185. It could be considered in conjunction with 1.2143, but it was not obvious. Therefore, it is not certain that traders have opened the necessary long position in order to profit from the upward movement during the day. Unfortunately, sometimes such ambiguous situations happen.
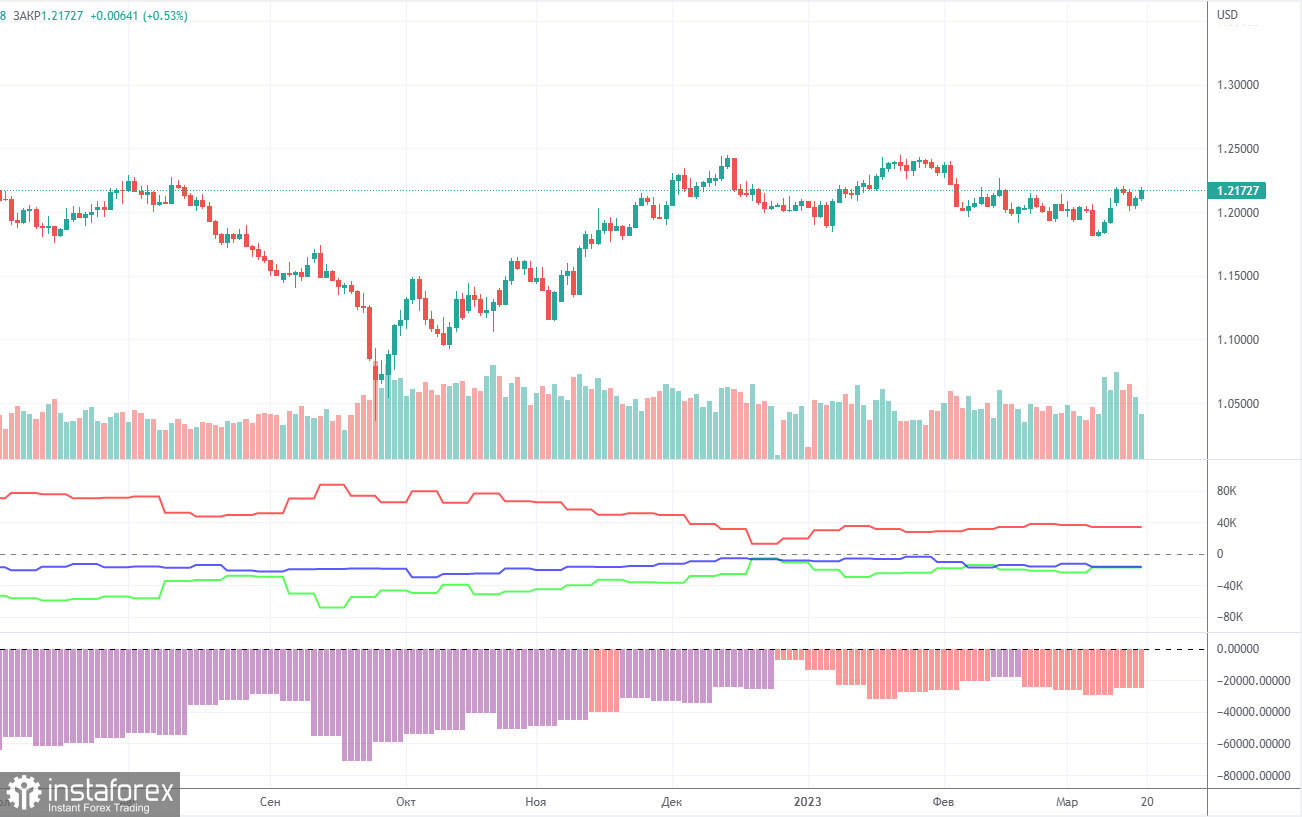
COT report:

This image is no longer relevant

For the British pound, the COT reports are still coming out very late, with the CFTC continuing to catch up on the chart. The last report available is for March 7. According to that report, the non-commercial group opened 7,500 long positions and 1,200 short ones. Thus, the net position of non-commercial traders increased by 6,300 and continues to grow. The net position indicator has been steadily growing over the past months but the mood of major traders still remains bearish. Although the pound sterling is growing against the dollar (in the medium term), it is very difficult to answer the question why it is doing this from a fundamental point of view. It is quite possible that the pound sterling may slump in the near future. Formally, it has already begun its downward movement but so far it looks more like a flat. Notably, both major pairs are moving similarly at the moment. However, the net position for the euro is positive and even implies the imminent completion of the upward momentum, whereas for the pound it is negative. But at the same time, the pound has already grown by 2100 points, which is a lot, and without a strong bearish correction the continuation of the growth will be absolutely illogical. The non-commercial group opened a total of 66,000 shorts and 46,000 longs. We remain skeptical about the long-term growth in the British currency and expect it to fall deeper.
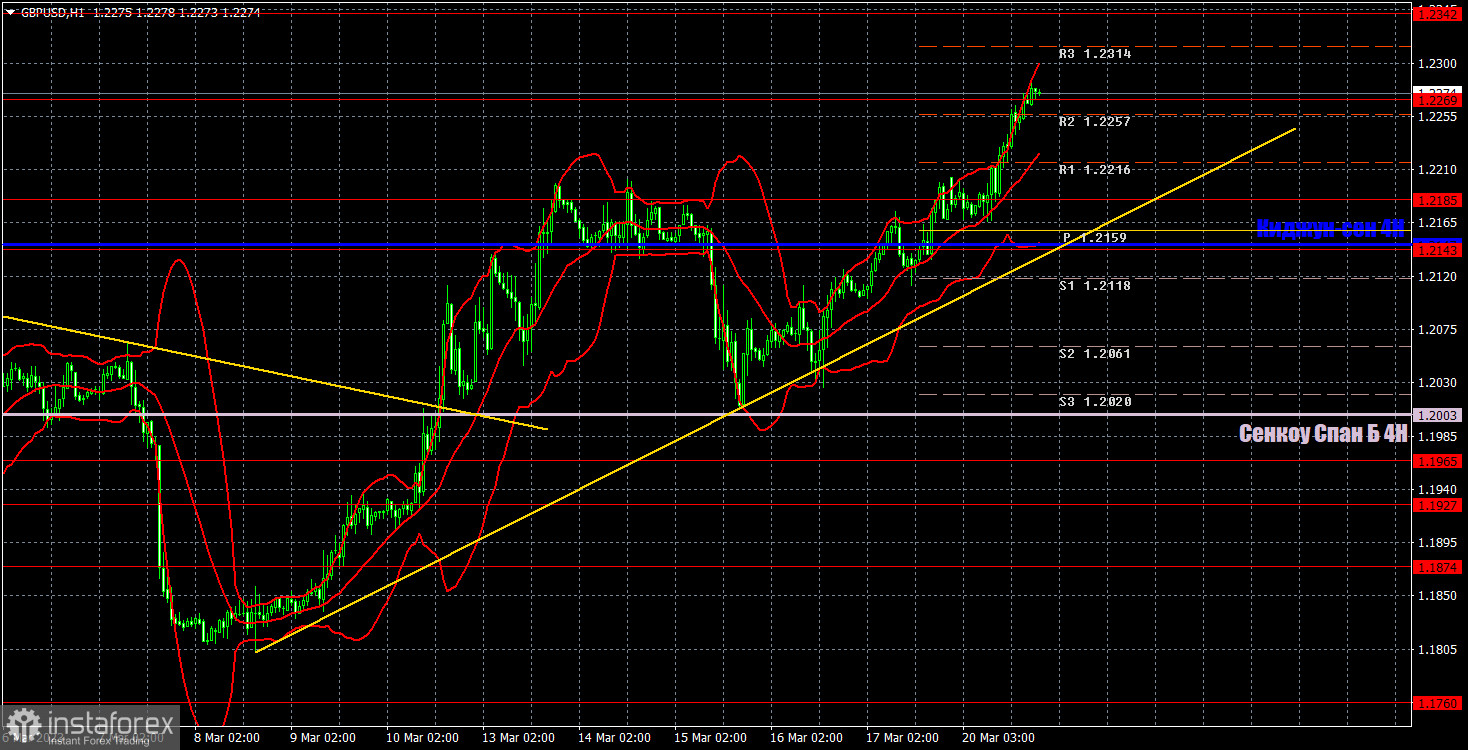
1H chart of GBP/USD

This image is no longer relevant

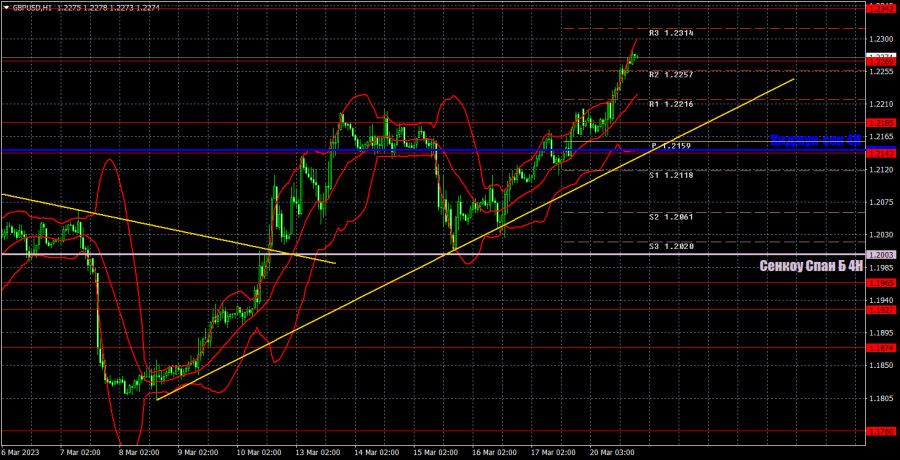
On the one-hour chart, GBP/USD continues to trade higher, supported by the trend line. However, it continues to move within the horizontal channel on the 24-hour chart, which, we should remember, is 600 pips wide. Therefore, the pound still has the potential for growth, but only technically. From a fundamental perspective, we have been waiting for the pound to fall, but at the moment there is a trend line, which supports the growth at least a little bit. So, at least, until it settles below the trend line, the pound might continue growing. On March 21, it is recommended to trade at the key level of 1.1927, 1.1965, 1.2143, 1.2185, 1.2269, 1.2342, 1.2429-1.2458, 1.2589. The Senkou Span B (1.2003) and Kijun Sen (1.2146) lines can also generate signals. Rebounds and breakouts from these lines can also serve as trading signals. It is better to set the Stop Loss at breakeven as soon as the price moves by 20 pips in the right direction. The lines of the Ichimoku indicator can change their position throughout the day which is worth keeping in mind when looking for trading signals. On Tuesday, there are no important events or reports planned for the UK or the US again. The pair may continue to move at an average pace with an upward bias based on technique.

Indicators on charts:

Resistance/support - thick red lines, near which the trend may stop. They do not make trading signals.

Kijun-sen and Senkou Span B are the Ichimoku indicator lines moved to the hourly timeframe from the 4-hour timeframe. They are also strong lines.

Extreme levels are thin red lines, from which the price used to bounce earlier. They can produce trading signals.

Yellow lines are trend lines, trend channels, and any other technical patterns.

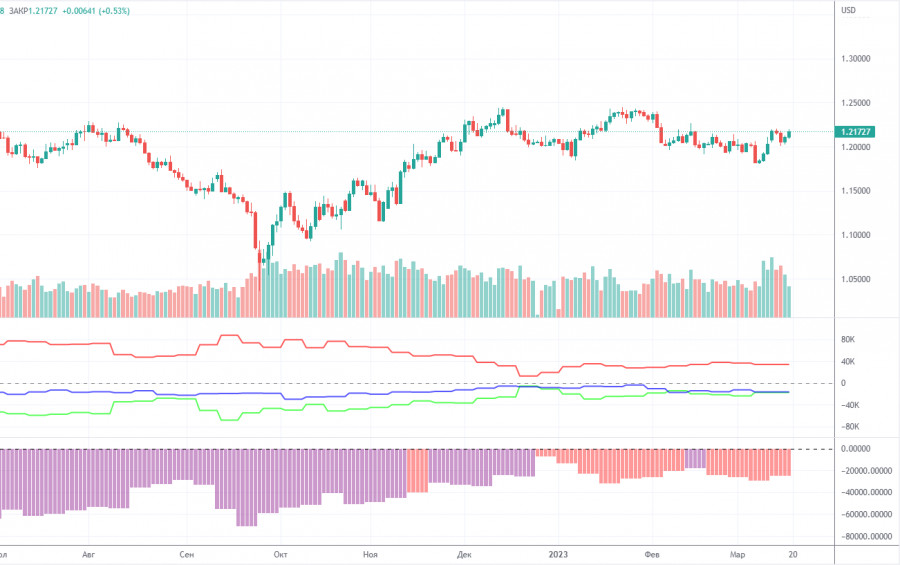
Indicator 1 on the COT chart is the size of the net position of each trader category.

Indicator 2 on the COT chart is the size of the net position for the Non-commercial group of traders.

Paolo Greco,
Analytical expert of InstaForex
© 2007-2025
Select timeframe
5
min
15
min
30
min
1
hour
4
hours
1
day
1
week
Earn on cryptocurrency rate changes with InstaForex
Download MetaTrader 4 and open your first trade
  • Grand Choice
    Contest by
    InstaForex
    InstaForex always strives to help you
    fulfill your biggest dreams.
    JOIN CONTEST

Recommended Stories

How to Trade the GBP/USD Pair on May 20? Simple Tips and Trade Analysis for Beginners

Analysis of Monday's Trades 1H Chart of GBP/USD Throughout Monday, the GBP/USD pair continued its upward movement, and at first glance, it might seem that a new uptrend is forming

Paolo Greco 05:40 2025-05-20 UTC+2

How to Trade the EUR/USD Pair on May 20? Simple Tips and Trade Analysis for Beginners

Analysis of Monday's Trades 1H Chart of EUR/USD The EUR/USD currency pair surged upward on Monday with renewed strength. But what justified this move, given that Monday's macroeconomic and fundamental

Paolo Greco 05:40 2025-05-20 UTC+2

Trading Recommendations and Analysis for GBP/USD on May 20: The Pound Keeps Seizing Every Opportunity

The GBP/USD currency pair continued its upward movement on Monday, which began last week. The price successfully broke through both Ichimoku indicator lines, so from a technical standpoint, the trend

Paolo Greco 04:09 2025-05-20 UTC+2

Trading Recommendations and Analysis for EUR/USD on May 20: The Dollar Is Looking for Reasons to Fall

The EUR/USD currency pair showed a relatively substantial rise on Monday. We believe there was no macroeconomic or fundamental justification for such a sharp depreciation of the U.S. dollar that

Paolo Greco 04:09 2025-05-20 UTC+2

How to Trade the EUR/USD Pair on May 19? Simple Tips and Trade Analysis for Beginners

Analysis of Friday's Trades 1H Chart of EUR/USD On Friday, the EUR/USD currency pair declined significantly in price, despite no macroeconomic or fundamental reasons. However, the downward trend

Paolo Greco 08:19 2025-05-19 UTC+2

Trading Recommendations and Analysis for GBP/USD on May 19: The Pound Feels Comfortable in a Flat Market

On Friday, the GBP/USD currency pair mainly traded downward throughout the day but closed with only a minor decline. This was mostly because the dollar weakened during the Asian session

Paolo Greco 04:42 2025-05-19 UTC+2

Trading Recommendations and Analysis for EUR/USD on May 19: The Dollar Struggles to Grow, but Still Does

The EUR/USD currency pair showed a slight decline on Friday. Although the 5-minute chart might suggest the pair spent the entire day in a downtrend, the U.S. dollar gained only

Paolo Greco 04:42 2025-05-19 UTC+2

How to Trade the GBP/USD Pair on May 19? Simple Tips and Trade Analysis for Beginners

Analysis of Friday's Trades 1H Chart of GBP/USD On Friday, the GBP/USD pair also traded lower, although there were no objective reasons. While the euro maintains a downward trend

Paolo Greco 00:35 2025-05-19 UTC+2

How to Trade the GBP/USD Pair on May 16? Simple Tips and Trade Analysis for Beginners

Analysis of Thursday's Trades 1H Chart of GBP/USD On Thursday, the GBP/USD pair showed minimal upward movement; however, the 5-minute timeframe indicates this was largely a sideways move

Paolo Greco 06:17 2025-05-16 UTC+2

How to Trade the EUR/USD Pair on May 16? Simple Tips and Trade Analysis for Beginners

Analysis of Thursday's Trades 1H Chart of EUR/USD The EUR/USD currency pair traded in both directions throughout Thursday. The macroeconomic background was rich, but it had no decisive impact

Paolo Greco 06:17 2025-05-16 UTC+2
Can't speak right now?
Ask your question in the chat.
Widget callback
 

Dear visitor,

Your IP address shows that you are currently located in the USA. If you are a resident of the United States, you are prohibited from using the services of InstaFintech Group including online trading, online transfers, deposit/withdrawal of funds, etc.

If you think you are seeing this message by mistake and your location is not the US, kindly proceed to the website. Otherwise, you must leave the website in order to comply with government restrictions.

Why does your IP address show your location as the USA?

  • - you are using a VPN provided by a hosting company based in the United States;
  • - your IP does not have proper WHOIS records;
  • - an error occurred in the WHOIS geolocation database.

Please confirm whether you are a US resident or not by clicking the relevant button below. If you choose the wrong option, being a US resident, you will not be able to open an account with InstaForex anyway.

We are sorry for any inconvenience caused by this message.