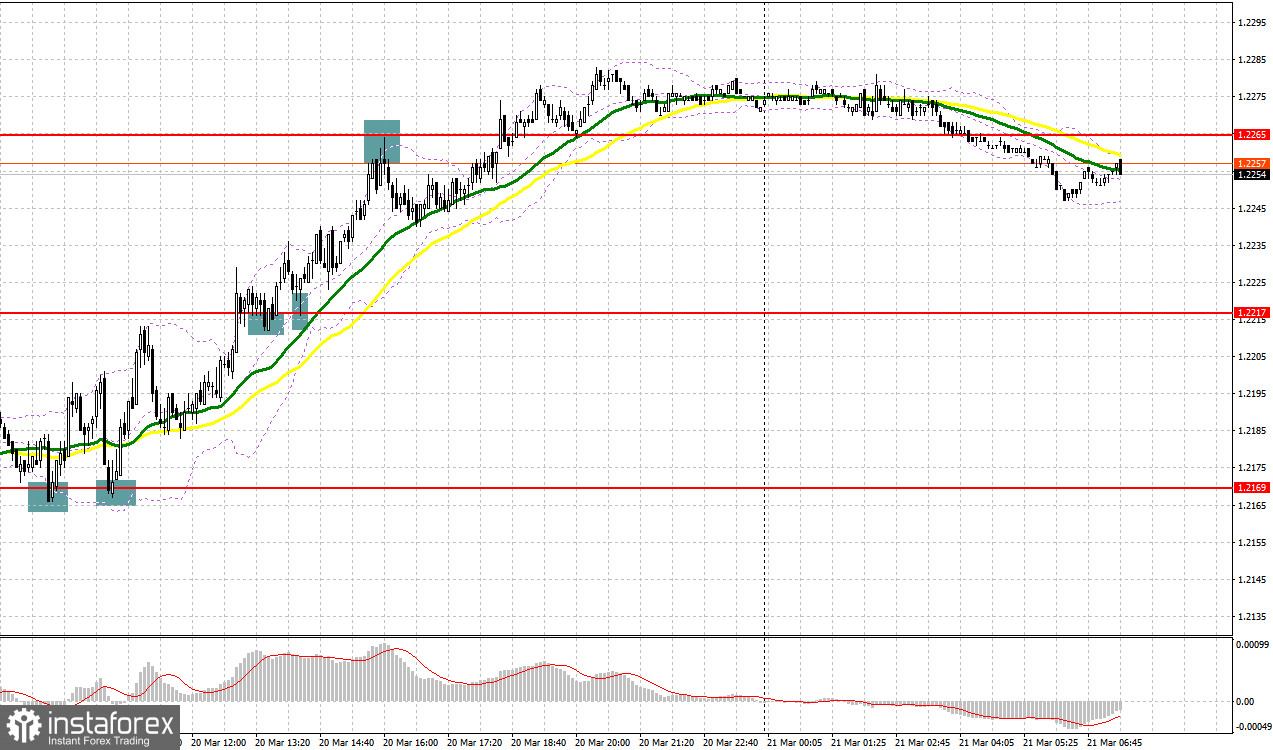
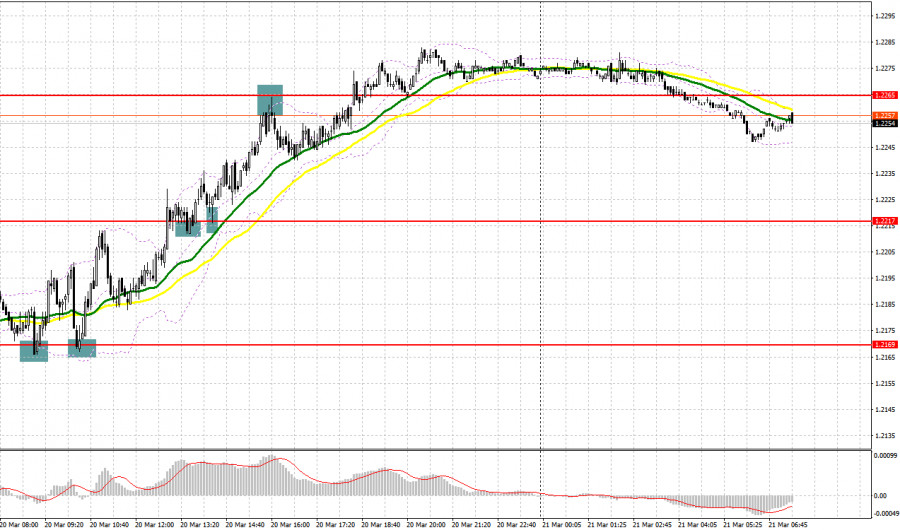
A few nice entry signals were generated yesterday. Let's look at the M5 chart to get a picture of what happened. In my previous review, I focused on the 1.2169 level and considered entering the market there. A buy signal was made after a fall in the price and a false breakout through 1.2169. As a result, the price swelled by over 40 pips. In the North American session, a breakout, consolidation above 1.2217, and a downward retest produced a buy signal. We saw a bullish continuation, with the pair rising by 50 pips.
When to open long positions on GBP/USD:
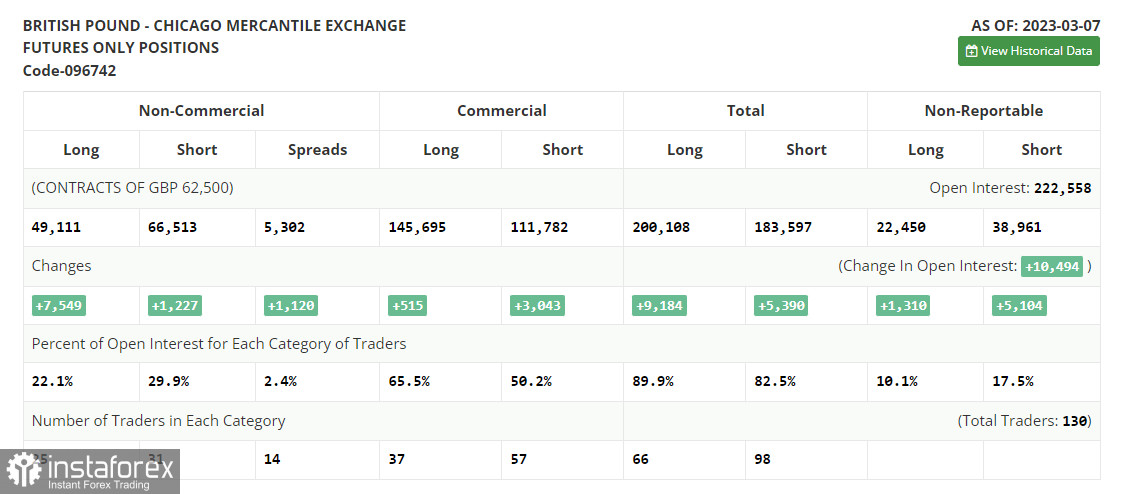
Before we proceed with the technical analysis, let's discuss the situation in the futures market. The COT report for March 7 logged a rise in both longs and shorts. However, these data have no weight whatsoever as the CFTC is still recovering after a cyber attack. All that's left is to wait for fresh reports. This week, the US Federal Reserve and the Bank of England will hold monetary policy meetings and make a decision on interest rates. The BoE is expected to stay hawkish due to persistent inflation. If the Fed gets dovish and the BoE does not, we will see GBP/USD reaching a new monthly high. According to the latest COT report, long non-commercial positions increased by 1,227 to 66,513. Short non-commercial positions rose by 7,549 to 49,111. The non-commercial net position came in at -17,141 versus -21,416. The weekly closing price fell to 1.1830 from 1.2112.
The pair is on its way to a fresh monthly high. Only disappointing public sector net borrowing in the UK could stop the price from going higher. Still, this report is of little interest to the market. Therefore, even if the quotes go down, a bullish bias will remain. The bulls should focus on the nearest support level of 1.2227. A false breakout through the mark will generate a buy signal, targetting 1.2294, a new monthly high. A breakout and a downside test will make a buy signal, and the pair will go to 1.2343. Without this level, the bulls will hardly be able to extend the uptrend. If the price goes even higher, a breakout through 1.2343 along with a downside retest will push the quotes to 1.2388 where I am going to lock in profits. The most distant target stands at 1.2450. The pair could test this mark if US macro data comes disappointing. If GBP/USD goes down and the bulls are absent at 1.2227, which is in line with the bullish moving averages, the bears will probably take the market under control. In such a case, it will become possible to open longs after a false breakout through 1.2169. Likewise, long positions could be opened on a bounce off 1.2115, allowing a correction of 30 to 35 pips intraday.
When to open short positions on GBP/USD:
In the European session, the bulls will likely try to break above the resistance level of 1.2294. Therefore, the bears should do everything to protect it. A false breakout through the mark following the release of a series of weak reports in the UK will produce a sell signal, targeting the nearest support at 1.2227. A breakout and an upward retest of this range will create a sell entity point, with the target at the 1.2169 low, which will be a nice downside correction after yesterday's growth. A more distant target is seen at 1.2115 where I am going to lock in profits. In case of growth in EUR/USD and the absence of the bears at 1.2294, the uptrend will extend and the bulls will maintain control over the market. GBP/USD will soar to the 1.2343 high. A false breakout through it will generate a sell entry point and drive the quotes further down. If there is no activity there, GBP/USD could be sold at 1.2388, allowing a correction of 30 to 35 pips intraday.
Indicator signals:
Moving averages
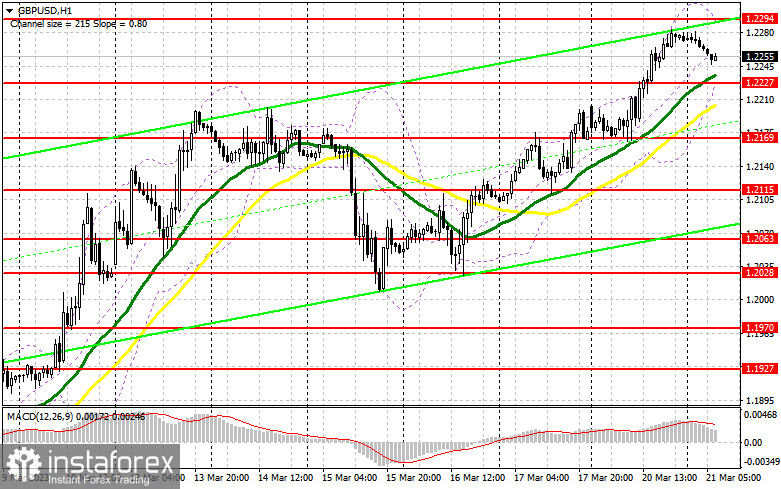
Trading is carried out above the 30-day and 50-day moving averages, indicating a bullish bias.
Note: The period and prices of moving averages are viewed by the author on the hourly chart and differ from the general definition of classic daily moving averages on the daily chart.
Bollinger Bands
Support stands at 1.2220, in line with the lower band. Resistance is seen at 1.2294, in line with the upper band.
Indicator description:
- Moving average (MA) determines the current trend by smoothing volatility and noise. Period 50. Colored yellow on the chart.
- Moving average (MA) determines the current trend by smoothing volatility and noise. Period 30. Colored green on the chart.
- Moving Average Convergence/Divergence (MACD). Fast EMA 12. Slow EMA 26. SMA 9.
- Bollinger Bands. Period 20
- Non-commercial traders are speculators such as individual traders, hedge funds, and large institutions who use the futures market for speculative purposes and meet certain requirements.
- Long non-commercial positions are the total long position of non-commercial traders.
- Non-commercial short positions are the total short position of non-commercial traders.
- Total non-commercial net position is the difference between the short and long positions of non-commercial traders.