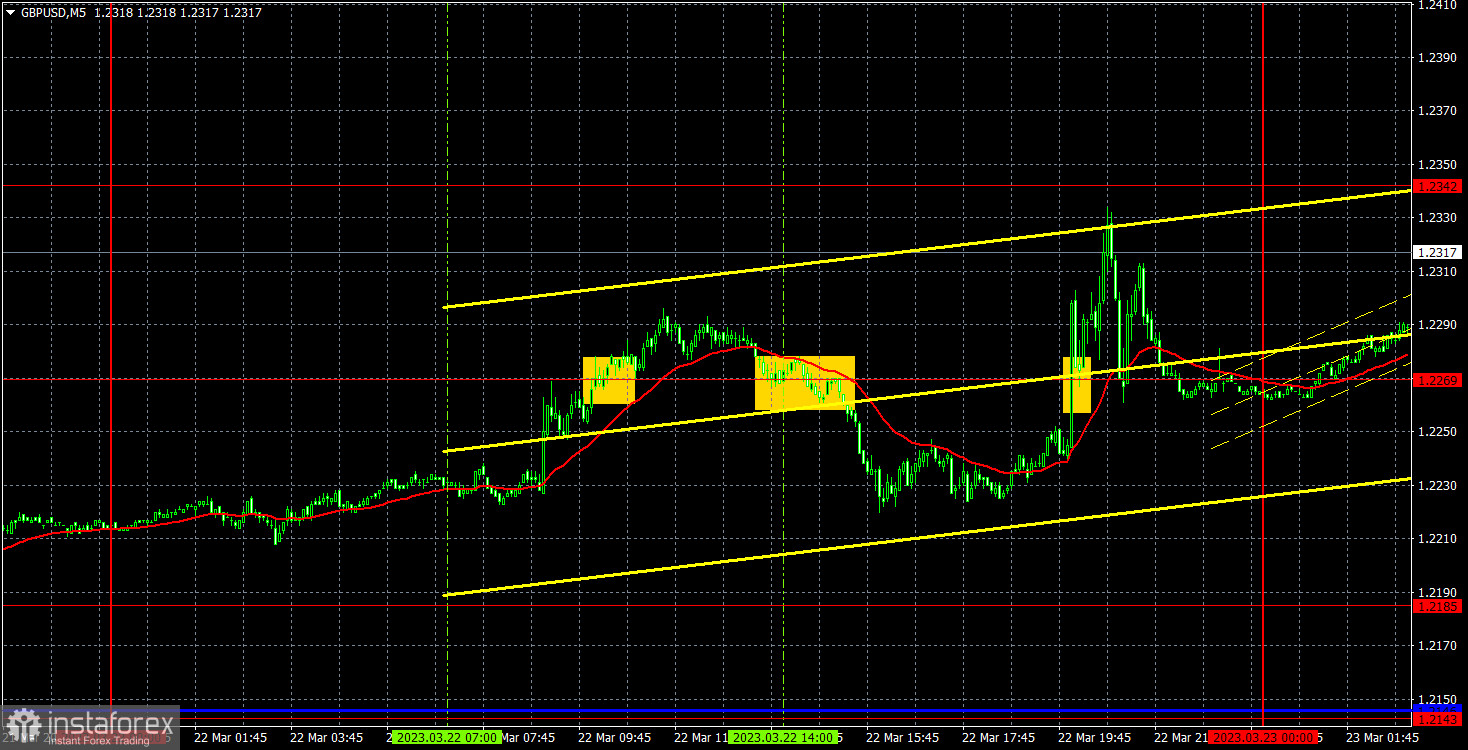
5M chart of GBP/USD
On Wednesday, GBP/USD was in a "swing" mode even on the one-hour chart. Basically, during the last week, the pound was also trading higher. And this despite the fact that the European Central Bank meeting is already behind us and the Bank of England meeting will be held today. Nevertheless, both currencies showed unusual growth, which makes us somewhat surprised. With the pound everything is clear, because on the 24-hour chart, it is still in the horizontal channel with the width of 600 points. This means that it can rise up to 1.2440, even without any fundamental reasons. But still it has been rising for more than a week, almost without a break. Something is wrong here. The pound was not deterred either by the results of the Federal Reserve meeting nor the disappointing inflation report. Traders are also unlikely to expect a 0.5% increase in the BoE key rate today... Nevertheless, we have what we have.
There were three signals on Wednesday, and all of them were near 1.2269. There was no sense to consider the last one, because it was formed when the Fed announced its decision, i.e. late in the evening. The first two turned out to be false, the price failed to reach the nearest target level neither in the first, nor in the second case. In the first case, it failed to go even 20 points up, so the long position closed with a small loss. The sell signal allowed the pair to go down 35 pips, so traders should have set the Stop Loss to Breakeven. The day was not very successful in terms of trading, but then again, not every day can be quite profitable.
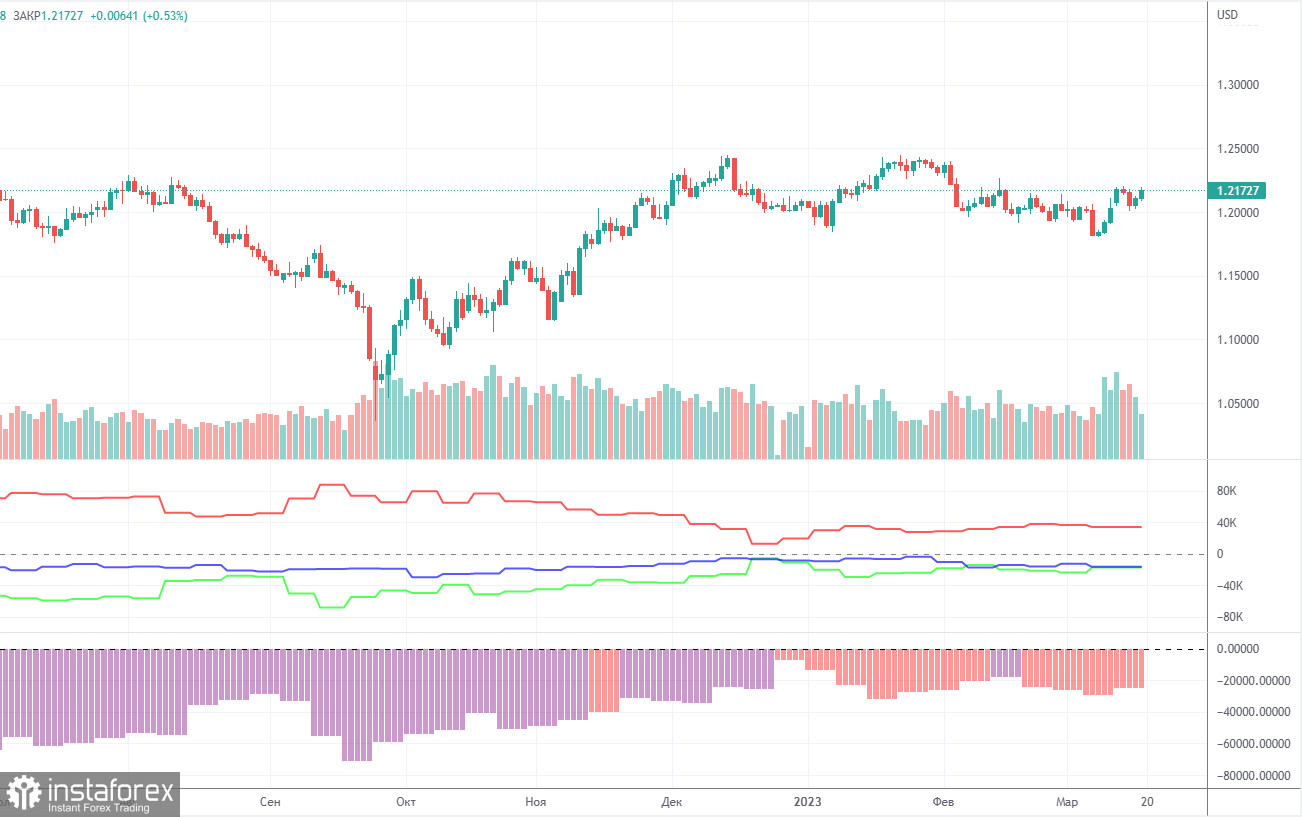
COT report:
For the British pound, the COT reports are still coming out very late, with the CFTC continuing to catch up on the chart. The last report available is for March 7. According to that report, the non-commercial group opened 7,500 long positions and 1,200 short ones. Thus, the net position of non-commercial traders increased by 6,300 and continues to grow. The net position indicator has been steadily growing over the past months but the mood of major traders still remains bearish. Although the pound sterling is growing against the dollar (in the medium term), it is very difficult to answer the question why it is doing this from a fundamental point of view. It is quite possible that the pound sterling may slump in the near future. Formally, it has already begun its downward movement but so far it looks more like a flat. Notably, both major pairs are moving similarly at the moment. However, the net position for the euro is positive and even implies the imminent completion of the upward momentum, whereas for the pound it is negative. But at the same time, the pound has already grown by 2100 points, which is a lot, and without a strong bearish correction the continuation of the growth will be absolutely illogical. The non-commercial group opened a total of 66,000 shorts and 46,000 longs. We remain skeptical about the long-term growth in the British currency and expect it to fall deeper.
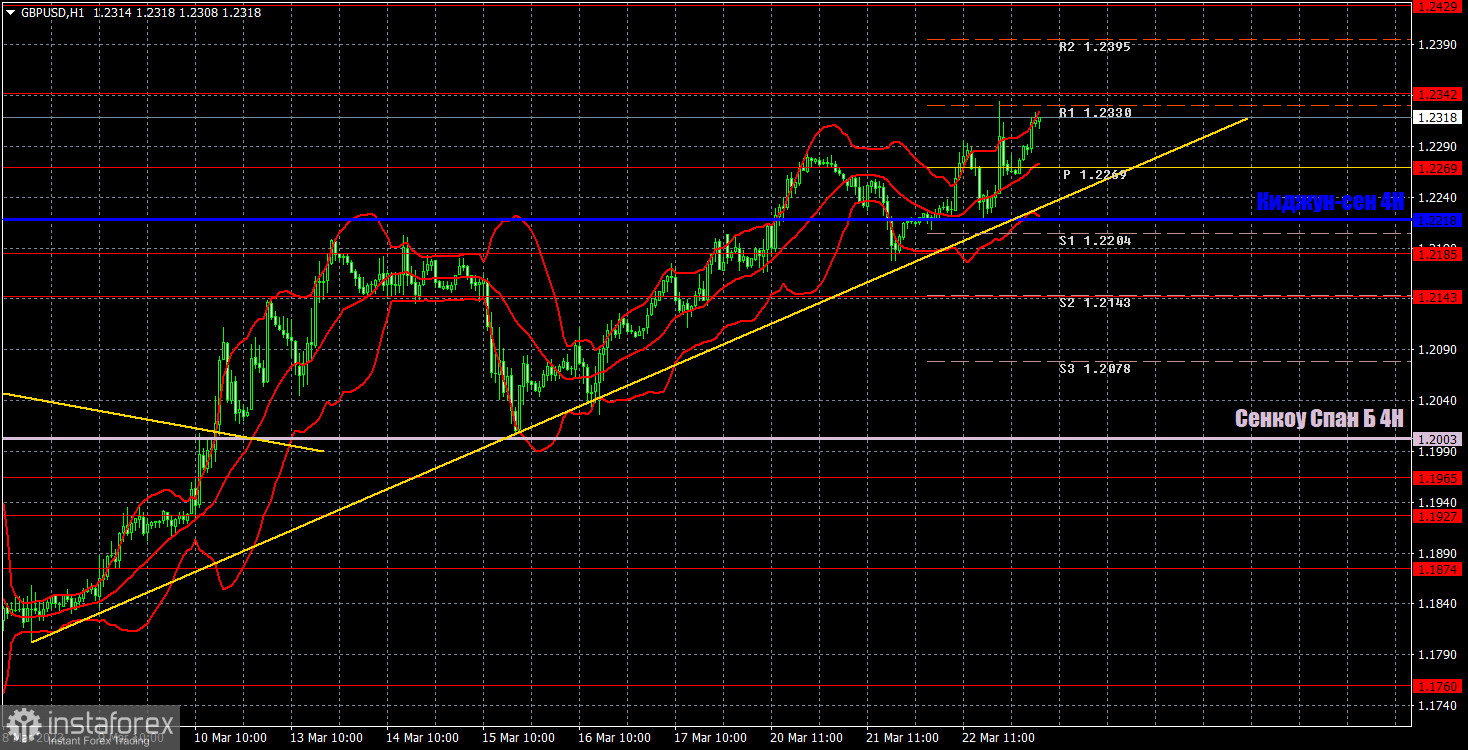
1H chart of GBP/USD
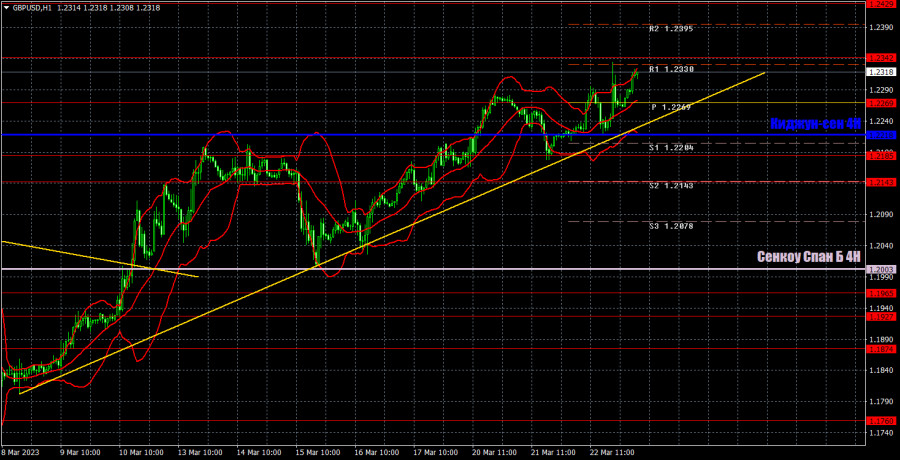
On the one-hour chart, GBP/USD continues to trade higher, supported by the trend line. However, it continues to move within the horizontal channel on the 24-hour chart, which, I should remind you, is 600 pips wide. Therefore, the pound has the potential to rise, but only technically. From a fundamental perspective, I have been expecting the pound to fall for a long time, but at the moment, there is a trend line, which supports the growth. Therefore, until the pair settles below the trend line, the uptrend could persist. On March 23, it is recommended to trade at the key level of 1.1927, 1.1965, 1.2143, 1.2185, 1.2269, 1.2342, 1.2429-1.2458, 1.2589. The Senkou Span B (1.2003) and Kijun Sen (1.2218) lines can also generate signals. Rebounds and breakouts from these lines can also serve as trading signals. It is better to set the Stop Loss at breakeven as soon as the price moves by 20 pips in the right direction. The lines of the Ichimoku indicator can change their position throughout the day which is worth keeping in mind when looking for trading signals. On Thursday, the BoE meeting will be the main event. If the pound moves up because of this, then the technical picture will look strange. But we have the trend line, so the technique supports the pair's growth.
Indicators on charts:
Resistance/support - thick red lines, near which the trend may stop. They do not make trading signals.
Kijun-sen and Senkou Span B are the Ichimoku indicator lines moved to the hourly timeframe from the 4-hour timeframe. They are also strong lines.
Extreme levels are thin red lines, from which the price used to bounce earlier. They can produce trading signals.
Yellow lines are trend lines, trend channels, and any other technical patterns.
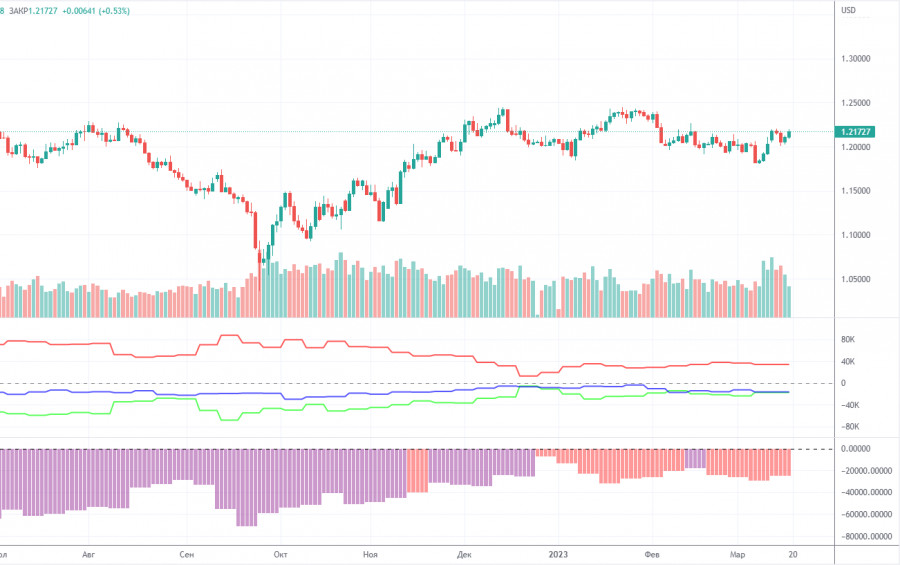
Indicator 1 on the COT chart is the size of the net position of each trader category.
Indicator 2 on the COT chart is the size of the net position for the Non-commercial group of traders.