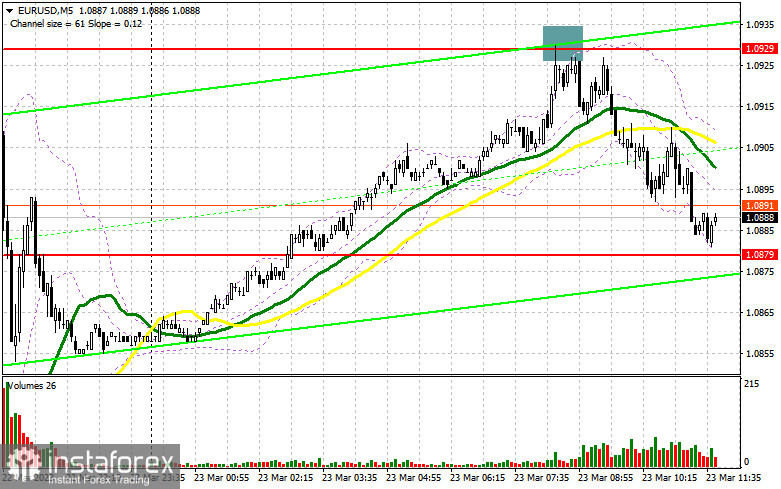
In my morning article, I turned your attention to 1.0929 and recommended making decisions with this level in focus. Now, let's look at the 5-minute chart and figure out what actually happened. Following a rise, a false breakout of 1.0929 led to a sell signal. The pair shed more than 50 pips. For the afternoon, the technical outlook remained the same as well as the trading strategy.
When to open long positions on EUR/USD:
The bulls were unable to defend 1.0929. So, a further trajectory of EUR/USD will depend on US economic data, namely initial jobless claims and new home sales. If the figures are upbeat, the pair is likely to hit the support level of 1.0879. Only a false breakout of this level will generate an entry point into long positions within the bullish trend and a rise to the resistance level of 1.0929. A similar situation occurred after a sell-off from 1.0929, which I analyzed above. A breakout and a downward retest of this level will give an additional entry point into long positions with an increase to 1.0964. It will be quite difficult for bulls to push the pair above this level. A breakout of 1.0964 will force the bears to close their Stop Loss orders. It will also stimulate the bullish trend, giving a buy signal with the possibility of a rise to 1.1000. At this level, I recommend locking in profits. If EUR/USD declines and buyers show no energy at 1.0879 in the afternoon, the pressure on the euro may return. It may undermine an upward movement that started yesterday after the Fed's key decision. A breakout of this level will also trigger a fall in EUR/USD to the support level of 1.0840. At this level, the moving averages are passing in positive territory. Only a false breakout of this level will provide new entry points. You could open long positions at a bounce from 1.0801 or 1.0761, keeping in mind an upward intraday correction of 30-35 pips.
When to open short positions on EUR/USD:
The sellers managed to regain the upper hand. Now, they need to protect 1.0929. In case of another jump to this level, only a false breakout will give a sell signal. The pair will fall to 1.0879. However, now, the target level is 1.0879. A breakout and an upward retest of this level amid strong US macro stats may trigger a decrease to 1.0840 where the moving averages are benefiting the bulls. A drop below this level will lead to a more significant drop to 1.0801, erasing yesterday's gains. At this level, I recommend locking in profits. If EUR/USD rises during the American session and bears show no energy at 1.0929, which is quite likely, I advise you to postpone short positions until a false breakout of 1.0964. You could sell at a bounce from 1.1000, keeping in mind a downward intraday correction of 30-35 pips.
COT report
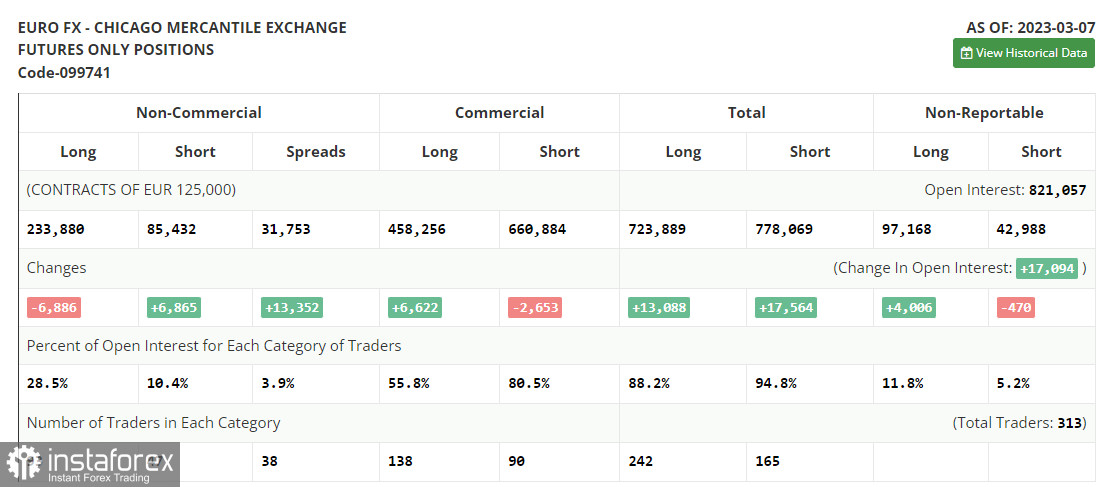
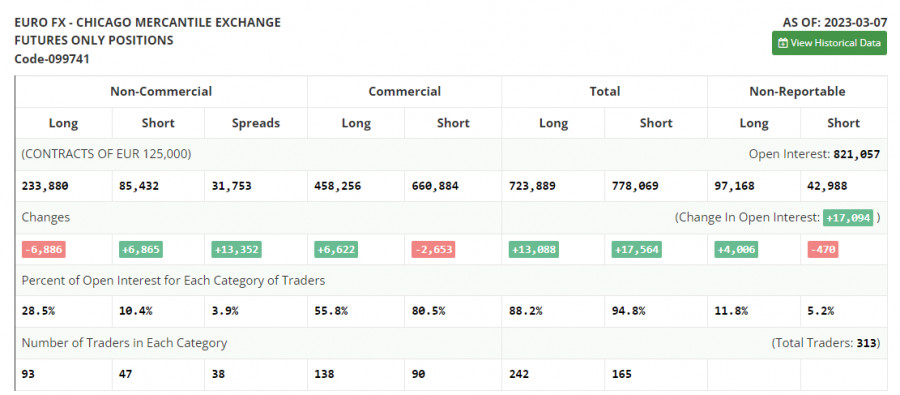
According to the COT report from March 7, the number of long positions dropped, whereas the number of short positions increased. Notably, the data is of zero importance at the moment as it was relevant two weeks ago. The CFTC is still recovering after a cyberattack. It is better to wait for new reports. This week, the Federal Reserve will hold a meeting, during which it may pause the monetary policy tightening. The fact is that the problems in the banking sector and the launch of a new credit swap line to support other banks with liquidity may seriously affect the economy. If Jerome Powell decides to raise the key rate higher, the US dollar is unlikely to receive support. Traders are pricing in the Fed's switch to a less hawkish stance and monetary policy loosening by the end of the year. The COT report unveiled that the number of long non-commercial positions dropped by 6,886 to 233,880, while the number of short non-commercial positions increased by 6,865 to 85,432. At the end of the week, the total non-commercial net position decreased to 148,448 against 165,038. The weekly closing price dropped to 1.0555 against 1.0698.
Indicators' signals:
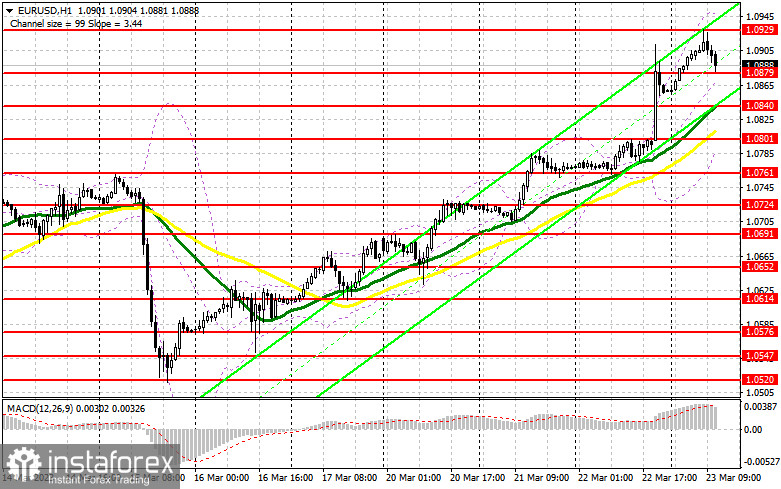
Trading is carried out above the 30 and 50 daily moving averages, which indicates bullish momentum.
Moving averages
Note: The period and prices of moving averages are considered by the author on the H1 (1-hour) chart and differ from the general definition of the classic daily moving averages on the daily D1 chart.
Bollinger Bands
If EUR/USD declines, the indicator's lower border at 1.0801 will act as support.
Description of indicators
- Moving average (moving average, determines the current trend by smoothing out volatility and noise). Period 50. It is marked yellow on the chart.
- Moving average (moving average, determines the current trend by smoothing out volatility and noise). Period 30. It is marked green on the chart.
- MACD indicator (Moving Average Convergence/Divergence - convergence/divergence of moving averages) Quick EMA period 12. Slow EMA period to 26. SMA period 9
- Bollinger Bands (Bollinger Bands). Period 20
- Non-commercial speculative traders, such as individual traders, hedge funds, and large institutions that use the futures market for speculative purposes and meet certain requirements.
- Long non-commercial positions represent the total long open position of non-commercial traders.
- Short non-commercial positions represent the total short open position of non-commercial traders.
- Total non-commercial net position is the difference between the short and long positions of non-commercial traders.