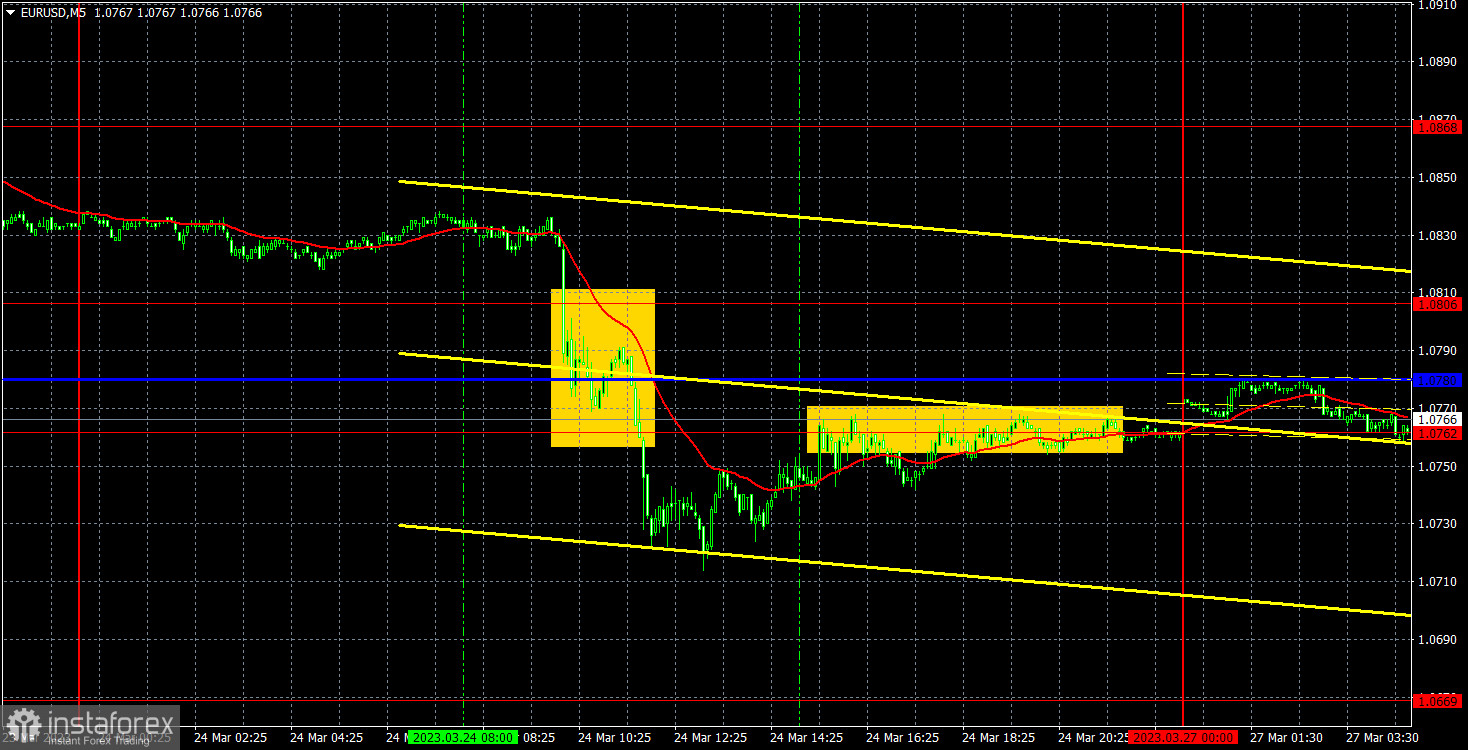
5M chart of EUR/USD
On Friday, EUR/USD entered a bearish correction. Prior to that, the euro was significantly rising, so the correction was inevitable. And don't forget the fact that the single currency's growth was not quite justified. It may seem that the pair's decline on Friday might have been caused by macro data. In particular, the PMIs on the services and manufacturing sectors that were released on that day. The US also released the same PMIs. However, if you look at the picture above, you can see that the pair just stood still during the US session! The eurozone manufacturing PMI turned out to be weaker than expected, but the services PMI was better, and by the end of the day, the euro fell. In other words, there was no logical market reaction. I don;t think the macro data had anything to do with the pair's movements on Friday.
Speaking of trading signals, the only thing I can point out is that the pair broke through the 1.0806-Kijun-sen-1.0762 area. Unfortunately, we failed to catch the start of the downward movement, and the fairly wide area made it difficult for traders to open short positions at the right moment. Therefore, we could not make any profit on this position. The pair passed in the right direction with some tens of points, but at the US session, it returned to 1.0762, where it closed the trading week. Therefore, the only position closed at Stop Loss on breakeven.
COT report:
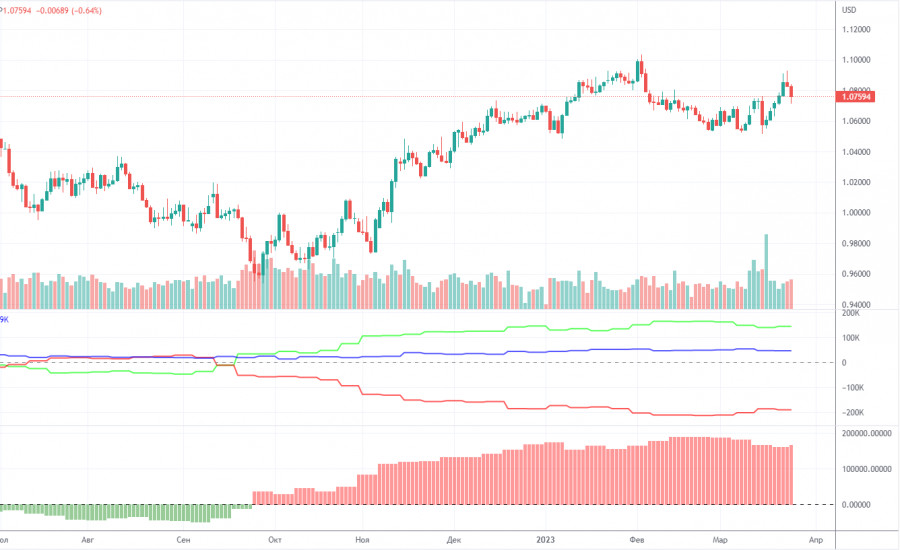
On Friday, the new COT report for March 21 was released. The Commodity Futures Trading Commission has caught up with the lost time and has now released reports exactly on time. In the last few months, the picture was completely consistent with what was happening in the market. On the chart above, we see that the net non-commercial position of large traders (second indicator) has risen since September 2022. At about the same time, the euro started to rise. The net non-commercial position is bullish and only started to fall during the last couple of weeks, which coincides with the euro's decline. I have already drawn your attention to the fact that a fairly high value of the "net position" allows us to expect the uptrend to stop shortly. Such a signal comes from the first indicator, with the green line and the red line being far apart, which is usually a sign of the end of a trend. The euro has already started to fall, but we don't know if it's just a bearish correction or a new downtrend. According to the latest report, non-commercial traders closed 6,500 long positions, while the number of short ones decreased by 11,300. Consequently, the net position rose by 4,800. The number of long positions exceeds that of short ones by 145,000. In any case, a correction has been looming for a long time. Therefore, even without reports, it is clear that the downtrend will continue.
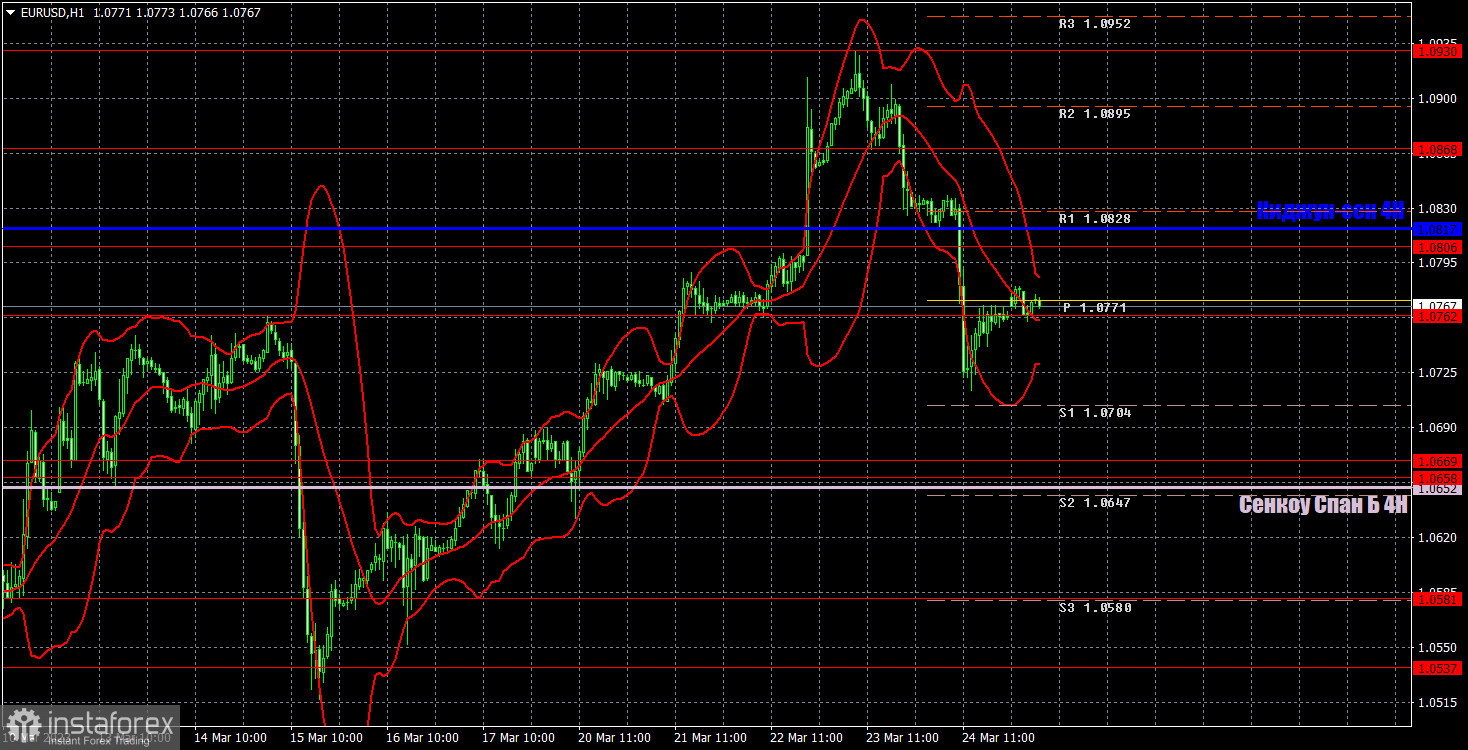
1H chart of EUR/USD
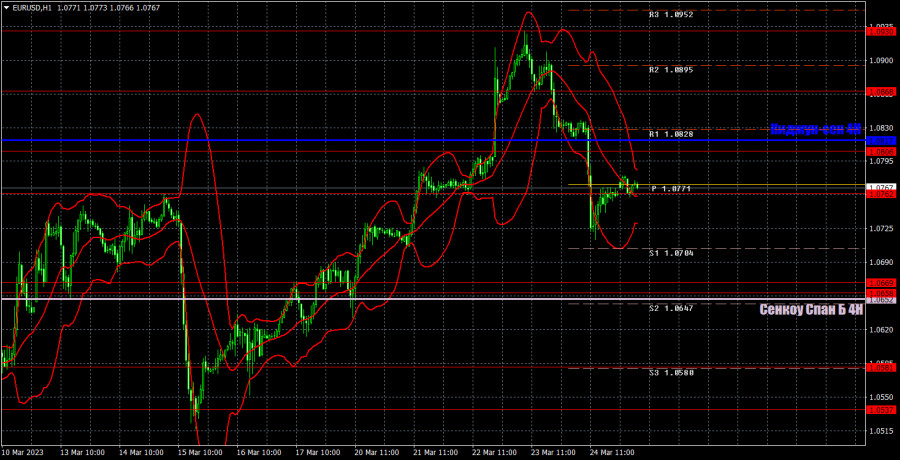
On the one-hour chart, EUR/USD grew for six straight days, so it seems logical that the pair has entered a correction. But don't forget that the "swing" could still persist. So far the price is above the Senkou Span B line, but below the Kijun-Sen. Therefore, the nearest target is the Senkou Span B. After that everything will depend on whether the line is surpassed or not. This week, there won't be many important events, so we should focus on technique instead. On Monday, important levels are seen at 1.0537, 1.0581, 1.0658-1.0669, 1.0762, 1.0806, 1.0868, 1.0938, 1.1033, 1.1137-1.1185, and also Senkou Span B (1.0652) and Kijun Sen (1.0817) lines. Ichimoku indicator lines can move intraday, which should be taken into account when determining trading signals. There are also support and resistance although no signals are made near these levels. They could be made when the price either breaks or rebounds from these extreme levels. Do not forget to place Stop Loss at the breakeven point when the price goes by 15 pips in the right direction. In case of a false breakout, it could save you from possible losses. On March 27, there are no important events or reports planned in the EU and the US. There will be nothing to react to during the day, so it is likely to be another "boring Monday". Nonetheless, the pair might continue to fall due to technical reasons.
Indicators on charts:
Resistance/support - thick red lines, near which the trend may stop. They do not make trading signals.
Kijun-sen and Senkou Span B are the Ichimoku indicator lines moved to the hourly timeframe from the 4-hour timeframe. They are also strong lines.
Extreme levels are thin red lines, from which the price used to bounce earlier. They can produce trading signals.
Yellow lines are trend lines, trend channels, and any other technical patterns.
Indicator 1 on the COT chart is the size of the net position of each trader category.
Indicator 2 on the COT chart is the size of the net position for the Non-commercial group of traders.