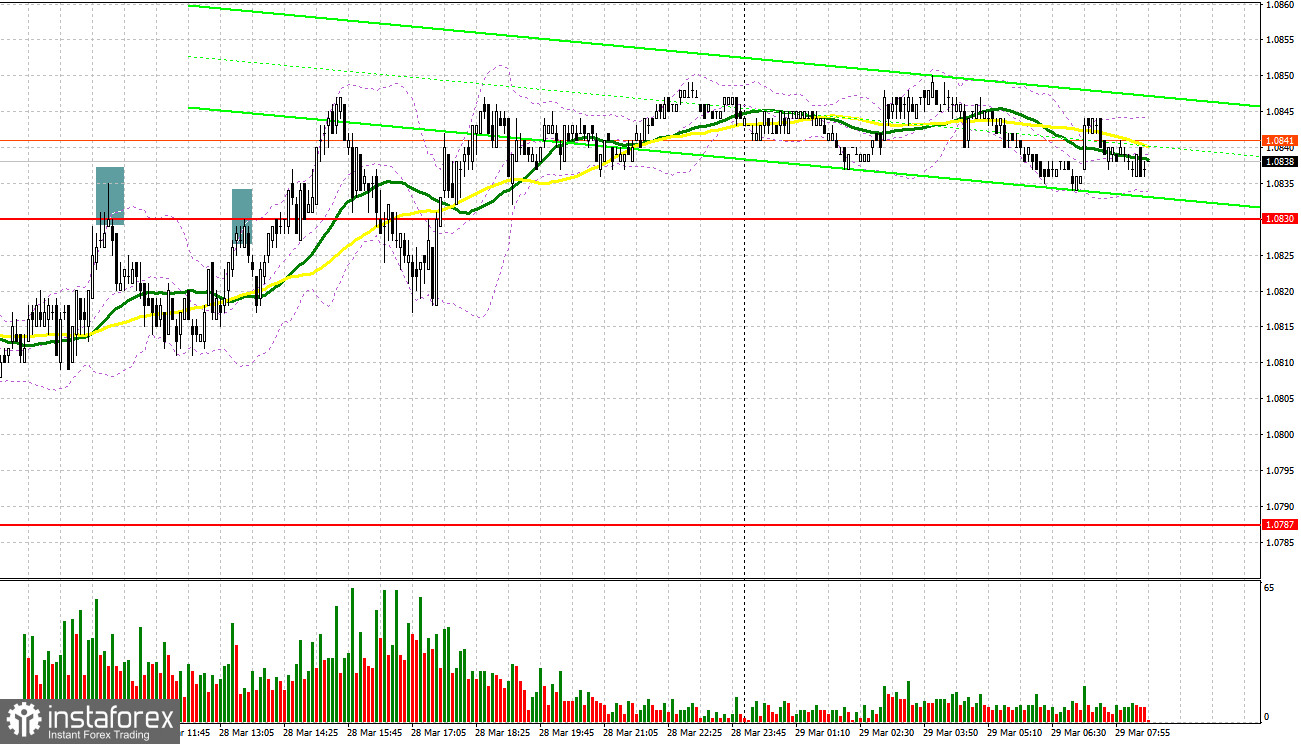
Yesterday, traders received several signals to enter the market. Let us take a look at the 5-minute chart to figure out what happened. Earlier, I asked you to pay attention to the level of 1.0830 to decide when to enter the market. A rise and a false breakout of this level led to a sell signal, which resulted in a 20-pip decline. In the second part of the day, traders saw one more false breakout of 1.0830. After that, the pair showed an insignificant drop.
Conditions for opening long positions on EUR/USD:
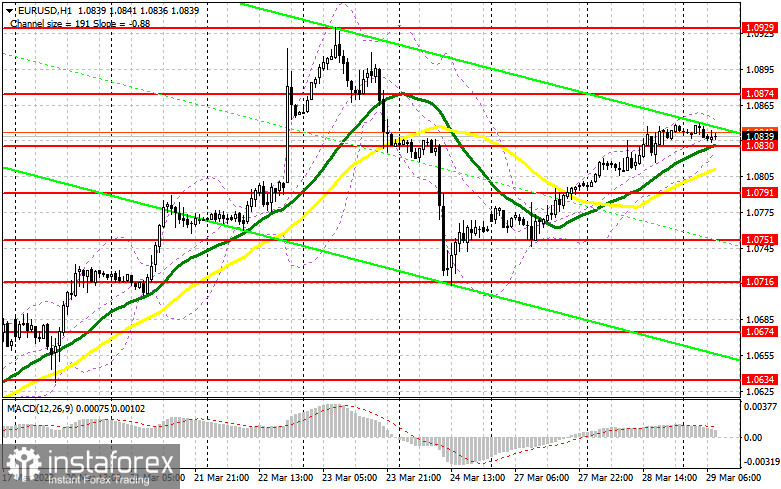
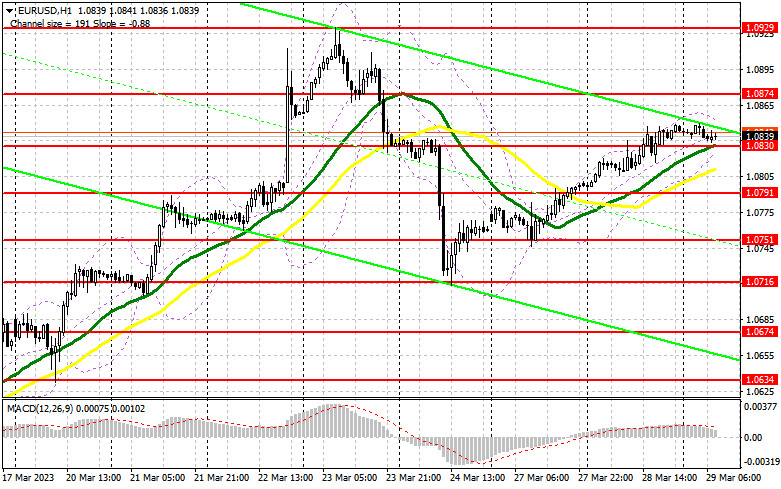
Today, the macroeconomic calendar is not rich in important events. That is why traders are likely to focus on Germany's consumer climate indicator and a speech that will be delivered by Member of the Executive Board of the ECB Isabel Schnabel. Notably, Isabel Schnabel has already provided some comments this week, thus boosting the euro. If Germany discloses weak data, pressure on the euro will increase and bulls will have to protect the nearest support level of 1.0830, where there are bullish MAs. A false breakout near this level will give a good long signal with the target at the nearest resistance level of 1.0874. A breakout and a downward test of this level will form one more long signal with the target at 1.0929, this month's high, where it is better to lock in profits. If the euro/dollar pair declines and buyers fail to protect 1.0830, which is highly possible under the current conditions, pressure on the euro will increase and it may slide to 1.0791. Only a false breakout of this level will give a buy signal. Traders may go long just after a bounce off the low of 1.0751 or even lower – at 1.0716, expecting a rise of 30-35 pips.
Conditions to open short positions on EUR/USD:
Sellers have taken a pause. They will have a chance to return to the market only after strong inflation data from the US. Now, they should primarily protect the level of 1.0874. Otherwise, the downward correction that started at the end of the previous week will stop. A zero reaction to the comments that will be provided by Isabel Schnabel may intensify pressure on the euro. It will be wise to open new sell positions after a false breakout of 1.0874, which will lead to a decline to the intermediate support level of 1.0830. A breakout and a reverse test of this level will cause a drop to 1.0791. If the price settles below this level amid weak data from Germany, it may slide deeper to 1.0751, thus encouraging bears. It is better to lock in profits at this level. If the euro/dollar pair declines during the European session and bears fail to protect 1.074, traders should avoid selling the asset until the price hits 1.0929. There, they may go short just after an unsuccessful settlement. It is also possible to open sell positions just after a rebound from the high of 1.0964, expecting a decline of 30-35 pips.
COT report
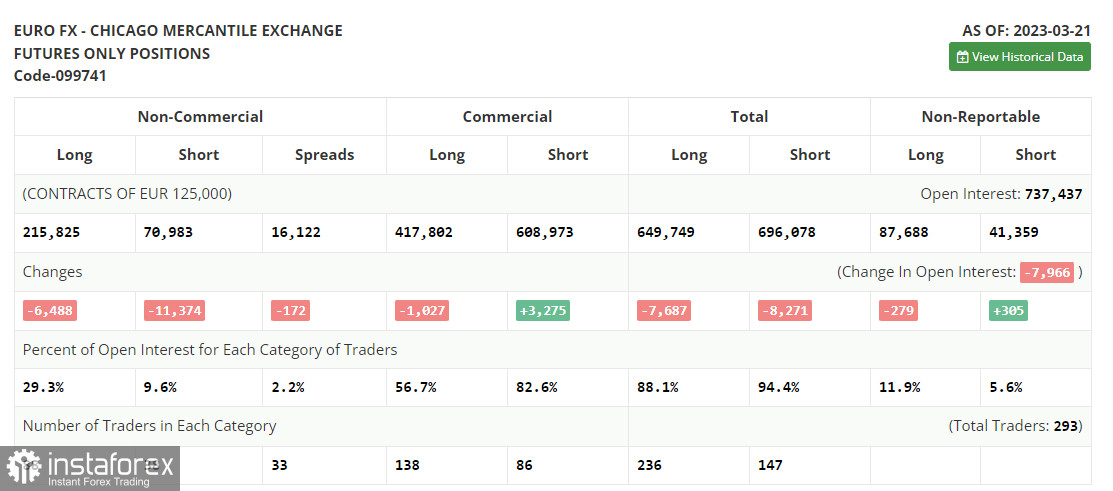
According to the COT report from March 21, the number of both long and short positions dropped. The Fed's meeting held in March affected the market situation. However, the US dollar is unlikely to slump since the regulator remained stuck to its policy. The aggressive approach of the ECB is the only fact that is supporting the euro at the moment. The central bank is planning to raise the key interest rate higher without altering its stance. Thus, the COT report unveiled that the number of long non-commercial positions decreased by 6,488 to 215,825, while the number of short non-commercial positions fell by 11,374 to 70,983. At the end of the week, the total non-commercial net position increased to 144,842 against 139,956. The weekly closing price rose to 1.0821 against 1.0803.
Signals of indicators:
Moving Averages
Trading is performed above the 30- and 50-day moving averages, which points to a further rise in the pair.
Note: The author considers the period and prices of moving averages on the one-hour chart which differs from the general definition of the classic daily moving averages on the daily chart.
Bollinger Bands
In case of a decline, the lower limit of the indicator located at 1.0825 will act as support.
Description of indicators
- Moving average (a moving average determines the current trend by smoothing volatility and noise). The period is 50. It is marked in yellow on the chart.
- Moving average (a moving average determines the current trend by smoothing volatility and noise). The period is 30. It is marked in green on the graph.
- MACD indicator (Moving Average Convergence/Divergence - convergence/divergence of moving averages). A fast EMA period is 12. A slow EMA period is 26. The SMA period is 9.
- Bollinger Bands. The period is 20.
- Non-profit speculative traders are individual traders, hedge funds, and large institutions that use the futures market for speculative purposes and meet certain requirements.
- Long non-commercial positions are the total number of long positions opened by non-commercial traders.
- Short non-commercial positions are the total number of short positions opened by non-commercial traders.
- The total non-commercial net position is a difference in the number of short and long positions opened by non-commercial traders.