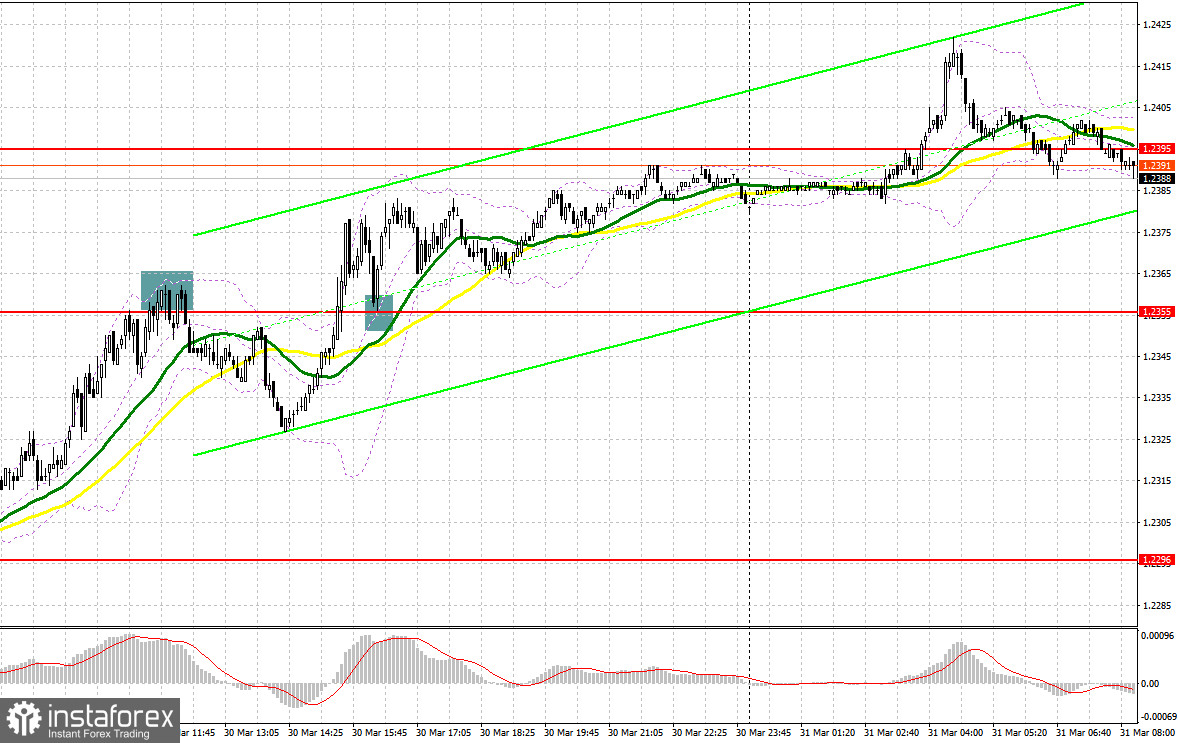
A few nice entry signals were generated yesterday. Let's look at the M5 chart to get a picture of what happened. In my previous review, I considered entering the market at 1.2355. A sell signal was made after a rise in the price and a false breakout by the middle of the day. The pair dropped by 30 pips. A breakout and a retest of the 1.2355 mark took place in the North American session, which produced a buy entry point and brought a profit of about 25 pips.
When to open long positions on GBP/USD:
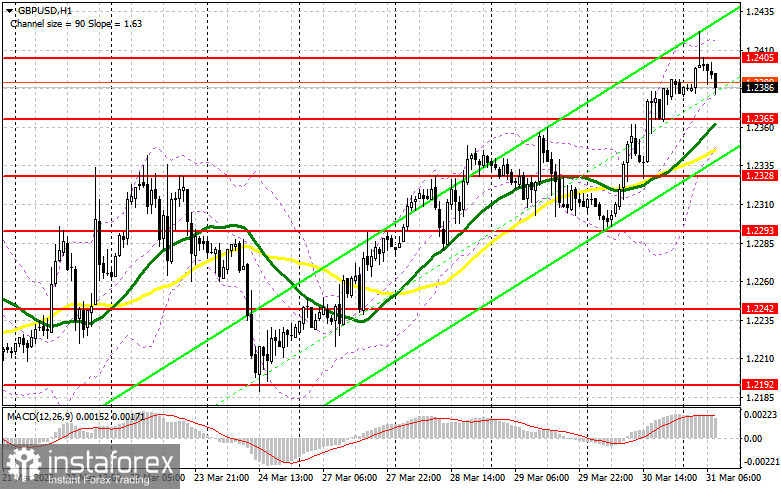
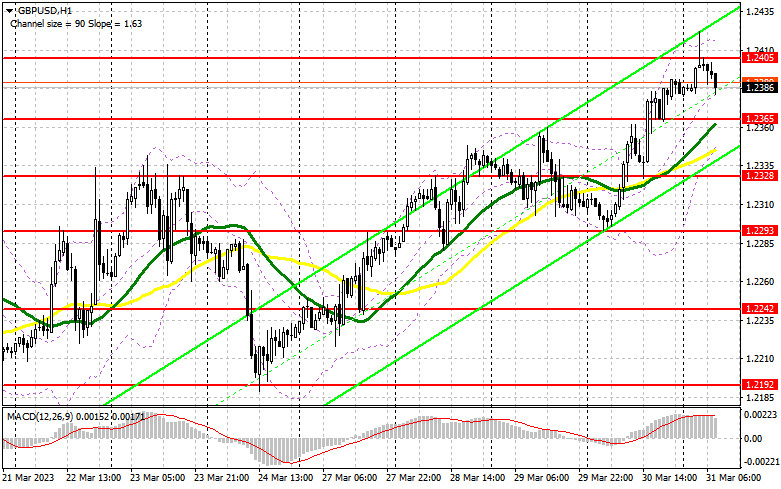
In the European session, a series of macro releases is expected, including data on UK GDP, current account, and business investments. Nevertheless, all eyes will be on the Nationwide house price index. If this report does not trigger a strong bearish reaction, the bulls will attempt to push the price above 1.2405 and update monthly highs. Of course, with the pound being at such a high level right now, it would be wiser to buy when the price falls and a false breakout through support at 1.2365 occurs. In fact, the barrier is in line with the bullish moving averages. This will make a buy signal, targeting 1.2405. After consolidation and a downside test of this range, GBP/USD may head toward 1.2443, where the bulls are likely to feel pressure. After a breakout through this range, the price may go to 1.2505, where I am going to take profit. If the bulls lose control over 1.2365, a deep bearish correction may occur by the end of the week. In such a case, the trading plan will be to buy after a false breakout through support at 1.2328. Likewise, long positions could be opened after a bounce off the 1.2293 low, allowing a correction of 30 to 35 pips intraday.
When to open short positions on GBP/USD:
This week, bullish sentiment in the market is fuelled by the statements from Bank of England officials who advocate for more rate increases. So, the bears have nothing to do about it. A bearish correction is likely to occur only if the pair attempts to go above 1.2405 after the publication of macro releases. A false breakout through the mark will make a signal to sell the instrument against the trend, targeting intermediate support at 1.2365. I expect some bullish activity at this level. A sell signal will be generated after a breakout and an upside retest of the 1.2365 mark. Target will stand at 1.2328 and 1.2293. However, the pair may approach the 1.2293 low if macro data in the US comes upbeat. In case GBP/USD ascends and there is no trading activity at 1.2405, which is highly likely, the bulls will maintain control over the market, and the pair will head toward a high of 1.2443. A false breakout through the mark will create a sell entry point. If no drop follows, I am going to sell GBP/USD on a bounce off the 1.2505 high, allowing a downward correction of 30 to 35 pips intraday.
Commitments of Traders:
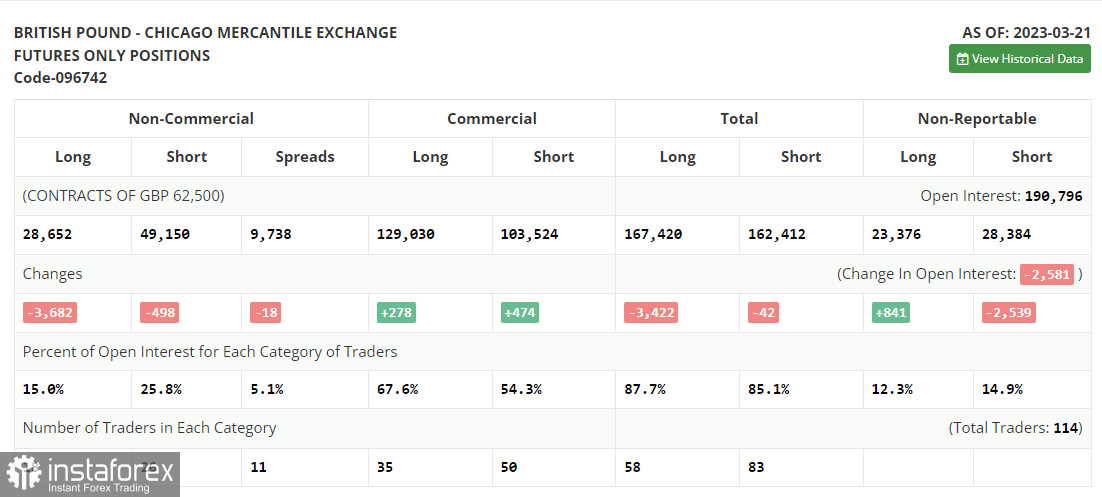
According to the COT report for March 21, long and short positions both decreased. The March meeting of the Bank of England did not bring any surprises. As widely expected, the regulator raised the interest rate, hinting at further monetary tightening due to persistent inflation in the UK. The latest data revealed a rise in consumer prices in February, which forced the regulator to maintain a hawkish stance. Given that many expect the Fed to pause monetary tightening, the pound sterling could extend its upward movement. The latest COT report showed that short non-commercial positions decreased by 498 to 49,150, while long non-commercial positions declined by 3,682 to 28,652. As a result, the non-commercial net position came in at -20,498 versus -17,314 a week earlier. The weekly closing price climbed to 1.2241 against 1.2199.
Indicator signals:
Moving averages
Trading is carried out above the 30-day and 50-day moving averages, indicating a bullish bias.
Note: The period and prices of moving averages are viewed by the author on the hourly chart and differ from the general definition of classic daily moving averages on the daily chart.
Bollinger Bands
Support stands at 1.2365, in line with the lower band.
Indicator description:
- Moving average (MA) determines the current trend by smoothing volatility and noise. Period 50. Colored yellow on the chart.
- Moving average (MA) determines the current trend by smoothing volatility and noise. Period 30. Colored green on the chart.
- Moving Average Convergence/Divergence (MACD). Fast EMA 12. Slow EMA 26. SMA 9.
- Bollinger Bands. Period 20
- Non-commercial traders are speculators such as individual traders, hedge funds, and large institutions who use the futures market for speculative purposes and meet certain requirements.
- Long non-commercial positions are the total long position of non-commercial traders.
- Non-commercial short positions are the total short position of non-commercial traders.
- Total non-commercial net position is the difference between the short and long positions of non-commercial traders.