empty
31.05.2023 04:40 AM
How to trade GBP/USD on May 31. Simple trading tips and analysis for beginners

Analyzing Tuesday's trades:

GBP/USD on 30M chart

This image is no longer relevant

On Tuesday, the GBP/USD pair displayed a significant rebound, which is difficult to explain from a fundamental or macroeconomic perspective. In addition, a new descending trendline has formed, which clearly passes through the three recent price peaks. Thus, despite the British currency's growth, the downtrend persists. There was no macro data or fundamental background in either the UK or the US. Therefore, it is quite difficult for us to explain what caused the dollar's decline. However, technical corrections are still relevant, so the sudden growth shouldn't be that surprising. So far, nothing bad has happened to the downtrend. The pound may fall as early as Wednesday, especially considering that the pair has already started to fall by the end of Tuesday. Moreover, there will be significant events and reports in the last three days of the week, which may prompt traders to buy the dollar again, regardless of their positions.
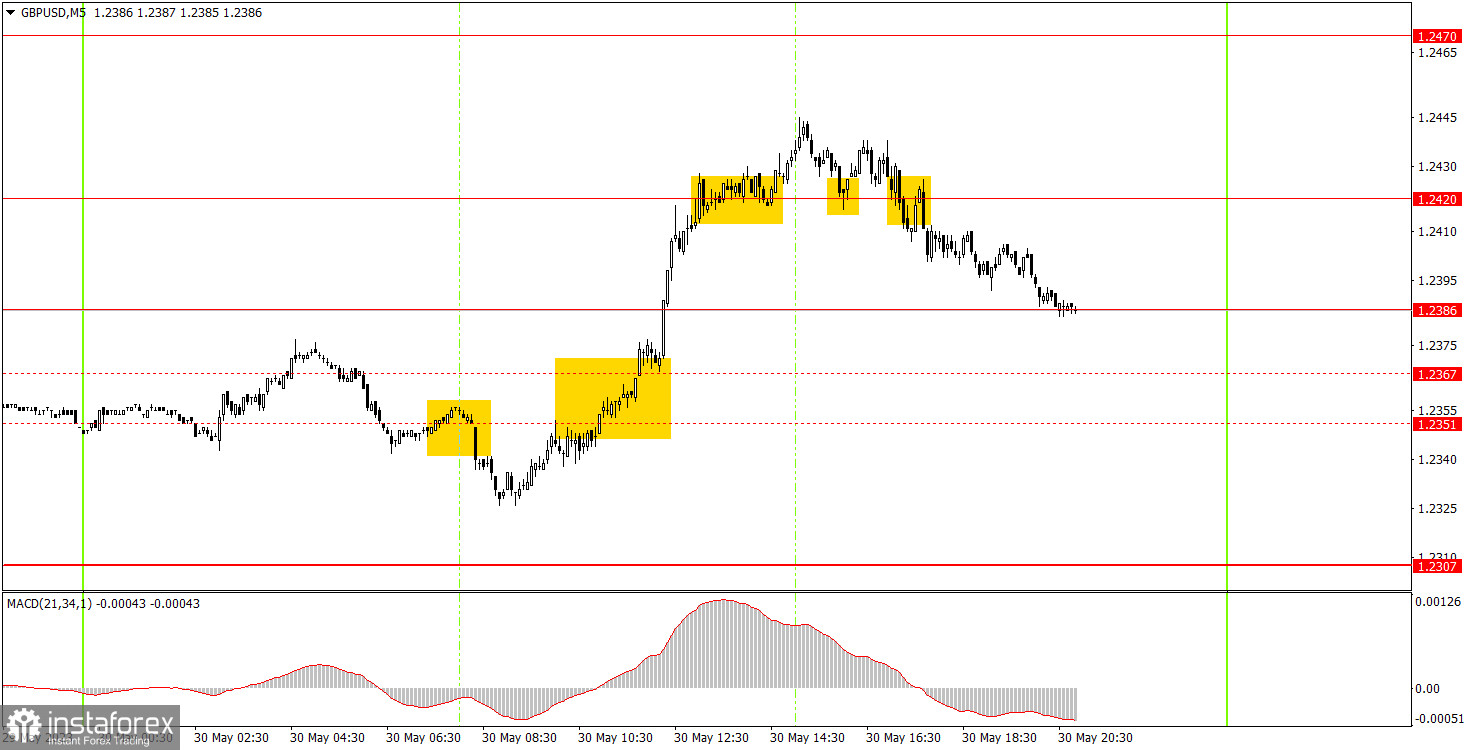
GBP/USD on 5M chart

This image is no longer relevant

Several trading signals were formed on the 5-minute chart on Tuesday. The levels 1.2351 and 1.2367 will be removed from the charts. The levels 1.2307 and 1.2386 have been added, but they were not included in the signal formation process. The first sell signal was near the 1.2351 level. The pair managed to move down by only 15 pips, resulting in a loss when the price settled above the 1.2367 level. This same signal should have been executed using long positions, and the pair subsequently rose to the 1.2420 level and settled above it. The long position should have been closed when the price settled below this level. Immediately after that, short positions should have been opened, which should have been manually closed closer to the evening. As a result, the first trade ended in a loss, but the other two were profitable. Overall, novice traders made a profit.

Trading tips on Wednesday:

As seen on the 30M chart, the GBP/USD pair is generally moving down, but over the past week, we have seen more of a flat than a trend-driven movement. I expect the pound to fall further since it has not fallen enough yet. Breaking the new trendline may temporarily change market sentiment to bullish. The key levels on the 5M chart are 1.2171-1.2179, 1.2245, 1.2307, 1.2386, 1.2420, 1.2470, 1.2507-1.2520, 1.2597-1.2616. When the price moves 20 pips in the right direction after opening a trade, a stop loss can be set at breakeven. On Wednesday, there are no important events or reports scheduled in the UK, while the US will release the JOLTS report on job openings. The market will only react to this report if the actual value significantly deviates from the forecast.

Basic rules of the trading system:

1) The strength of the signal depends on the time period during which the signal was formed (a rebound or a break). The shorter this period, the stronger the signal.

2) If two or more trades were opened at some level following false signals, i.e. those signals that did not lead the price to Take Profit level or the nearest target levels, then any consequent signals near this level should be ignored.

3) During the flat trend, any currency pair may form a lot of false signals or do not produce any signals at all. In any case, the flat trend is not the best condition for trading.

4) Trades are opened in the time period between the beginning of the European session and until the middle of the American one when all deals should be closed manually.

5) We can pay attention to the MACD signals in the 30M time frame only if there is good volatility and a definite trend confirmed by a trend line or a trend channel.

6) If two key levels are too close to each other (about 5-15 pips), then this is a support or resistance area.

How to read charts:

Support and Resistance price levels can serve as targets when buying or selling. You can place Take Profit levels near them.

Red lines are channels or trend lines that display the current trend and show which direction is better to trade.

MACD indicator (14,22,3) is a histogram and a signal line showing when it is better to enter the market when they cross. This indicator is better to be used in combination with trend channels or trend lines.

Important speeches and reports that are always reflected in the economic calendars can greatly influence the movement of a currency pair. Therefore, during such events, it is recommended to trade as carefully as possible or exit the market in order to avoid a sharp price reversal against the previous movement.

Beginners should remember that every trade cannot be profitable. The development of a reliable strategy and money management are the key to success in trading over a long period of time.

Paolo Greco,
Analytical expert of InstaForex
© 2007-2025
Select timeframe
5
min
15
min
30
min
1
hour
4
hours
1
day
1
week
Earn on cryptocurrency rate changes with InstaForex
Download MetaTrader 4 and open your first trade
  • Grand Choice
    Contest by
    InstaForex
    InstaForex always strives to help you
    fulfill your biggest dreams.
    JOIN CONTEST

Recommended Stories

How to Trade the GBP/USD Pair on May 23? Simple Tips and Trade Analysis for Beginners

Analysis of Thursday's Trades 1H Chart of GBP/USD The GBP/USD pair didn't even attempt a correction on Thursday. While the euro faced bearish pressure from weak business activity indices

Paolo Greco 05:58 2025-05-23 UTC+2

How to Trade the EUR/USD Pair on May 23? Simple Tips and Trade Analysis for Beginners

Analysis of Thursday's Trades 1H Chart of EUR/USD On Thursday, the EUR/USD currency pair corrected to the nearest support level on the hourly timeframe, which was at 1.1267. Multiple factors

Paolo Greco 05:57 2025-05-23 UTC+2

Trading Recommendations and Analysis for GBP/USD on May 23: Pound Prepares for a Historic Breakout

The GBP/USD currency pair broke out of its sideways channel through the upper boundary, but it is in no hurry to continue rising. Traders appear to be gathering momentum

Paolo Greco 03:43 2025-05-23 UTC+2

Trading Recommendations and Analysis for EUR/USD on May 23: The Euro Couldn't Withstand the Pressure

On Thursday, the EUR/USD currency pair traded lower, which can be considered an exception to the general trend. Nearly all macroeconomic reports during the day were unfavorable for the euro

Paolo Greco 03:43 2025-05-23 UTC+2

How to Trade the GBP/USD Pair on May 22? Simple Tips and Trade Analysis for Beginners

Analysis of Wednesday's Trades 1H Chart of GBP/USD The GBP/USD pair maintained its upward trend on Wednesday, a movement that has developed over the past two weeks. Recall that

Paolo Greco 06:31 2025-05-22 UTC+2

How to Trade the EUR/USD Pair on May 22? Simple Tips and Trade Analysis for Beginners

Analysis of Wednesday's Trades 1H Chart of EUR/USD On Wednesday, the EUR/USD currency pair continued its upward movement calmly and steadily. The price broke through the 1.1267 level, which

Paolo Greco 06:31 2025-05-22 UTC+2

Trading Recommendations and Analysis for GBP/USD on May 22: The Pound Breaks Through Key Levels

The GBP/USD currency pair also resumed its upward movement on Wednesday. The rise of the British pound, which in reality still reflects the fall of the US dollar, began overnight

Paolo Greco 03:30 2025-05-22 UTC+2

Trading Recommendations and Analysis for EUR/USD on May 22: Reasons Don't Matter and Aren't Needed

The EUR/USD currency pair resumed its upward movement on Wednesday, and it is now safe to say that the uptrend is present not only in the hourly timeframe but also

Paolo Greco 03:30 2025-05-22 UTC+2

How to Trade the GBP/USD Pair on May 21? Simple Tips and Trade Analysis for Beginners

Analysis of Tuesday's Trades 1H Chart of GBP/USD The GBP/USD pair mainly traded sideways on Tuesday, but early Wednesday morning it surged upward. On the 4-hour timeframe, it's clear that

Paolo Greco 06:17 2025-05-21 UTC+2

How to Trade the EUR/USD Pair on May 21? Simple Tips and Trade Analysis for Beginners

Analysis of Tuesday's Trades 1H Chart of EUR/USD On Tuesday, the EUR/USD currency pair traded sideways, but it resumed its upward movement early Wednesday morning. This indicates that the ongoing

Paolo Greco 06:17 2025-05-21 UTC+2
Can't speak right now?
Ask your question in the chat.
Widget callback
 

Dear visitor,

Your IP address shows that you are currently located in the USA. If you are a resident of the United States, you are prohibited from using the services of InstaFintech Group including online trading, online transfers, deposit/withdrawal of funds, etc.

If you think you are seeing this message by mistake and your location is not the US, kindly proceed to the website. Otherwise, you must leave the website in order to comply with government restrictions.

Why does your IP address show your location as the USA?

  • - you are using a VPN provided by a hosting company based in the United States;
  • - your IP does not have proper WHOIS records;
  • - an error occurred in the WHOIS geolocation database.

Please confirm whether you are a US resident or not by clicking the relevant button below. If you choose the wrong option, being a US resident, you will not be able to open an account with InstaForex anyway.

We are sorry for any inconvenience caused by this message.