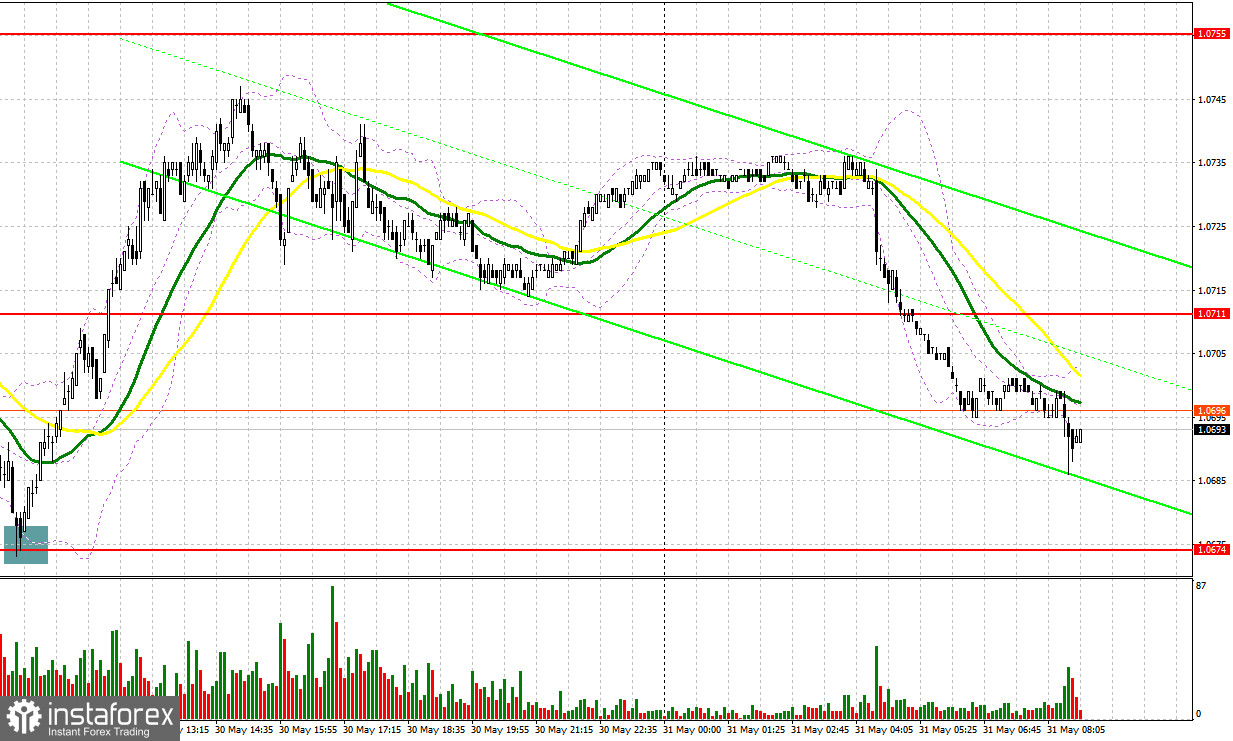
Yesterday, there was only one signal to enter the market. Let's have a look at the 5-minute chart and see what happened there. In my morning review, I mentioned the level of 1.0674 as a possible entry point. The decline and false-breakout of this mark led to a great buy signal. By the middle of the day, the pair grew by more than 50 pips.
For long positions on EUR/USD:
The report on eurozone bank lending weakening further hurt the pair in the first half of the day, but a renewal of monthly lows led to profit taking and a bounce. But during the US session, the euro was under pressure again. And in today's Asian session, the pair was again subjected to a large sell-off. Considering that quite a lot of data is scheduled for release in the first half of the day, the bulls will have a chance to correct the situation. For this purpose, we need to see a decline in the number of the unemployed in Germany in May this year, as well as the decrease of the unemployment rate. A rise in Germany's consumer price index will also allow buyers to regain control of the market.
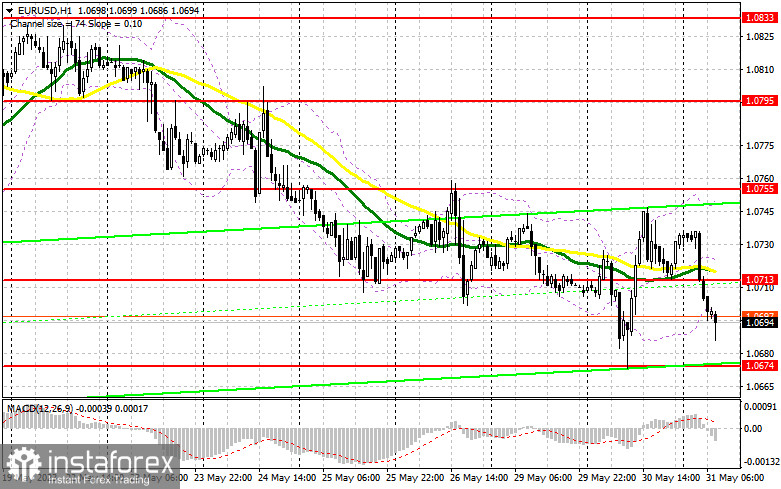
But like yesterday, I will buy only after a fall and a false breakout through the monthly low of 1.0674. A good report about the European Central Bank financial stability and the hawkish comments of ECB President Christine Lagarde will ensure that buyers are willing to push the euro up against the bearish trend, which will give us a chance to enter long positions at the end of the month while the next target will be the nearest resistance at 1.0713, which is in line with the bearish moving averages. A breakout and a downside test of this mark later in the afternoon will strengthen the demand for the euro and provide another buy entry point with a new high around 1.0755, which we missed yesterday. The most distant target is seen at 1.0795 where I will lock in profits.
If there is no bullish activity at 1.0674, which is less likely at the end of this month, we can expect further trend development. A false breakout through 1.0634 support will generate a buy signal. I will open long positions from the low of 1.0595, allowing a bullish correction of 30-35 pips intraday.
For short positions on EUR/USD:
The market is balanced for the time being, but sellers are in control of the market. Traders should protect the nearest resistance level at 1.0713. A suitable scenario for building up short positions in continuation of the trend, similar to yesterday. A false breakout through this mark will produce a sell signal, targeting the low of 1.0674. In case of consolidation below this range and its retest to the upside, the price will head toward 1.0634. The most distant target is seen at the low of 1.0595 where I will lock in profits.
In case EUR/USD goes up during the European session and there are no bears at 1.0713, profit taking at the end of the month may result in significant growth. Therefore, I will sell the instrument at 1.0755 after failed consolidation. I will also consider selling on a bounce from the high of 1.0795, allowing a bearish correction of 30-35 pips.
COT report:
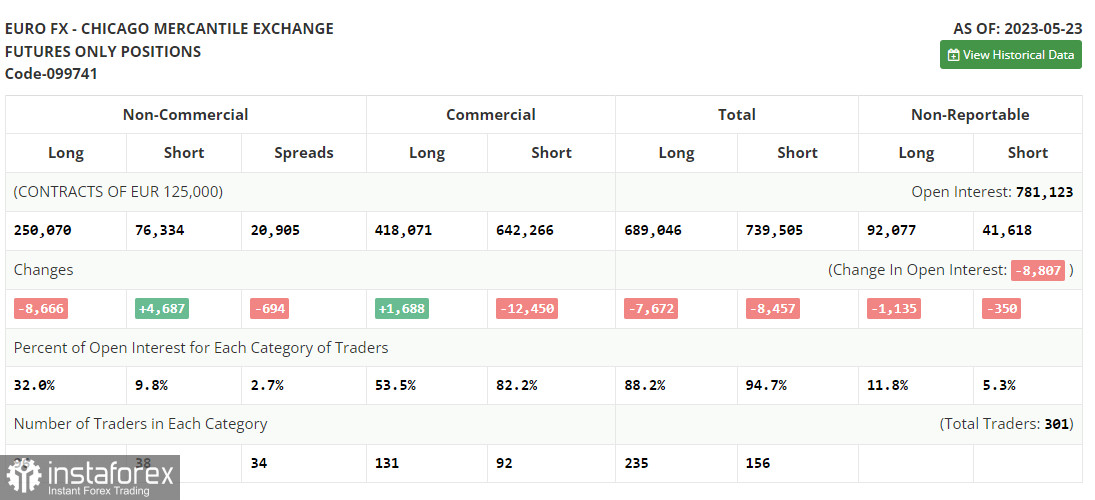
According to the COT report for May 23, long positions decreased and short positions grew. The euro extended the fall because the US debt ceiling was then a burning issue and recession risks were high. However, even when the debt limit deal was reached, demand for the greenback remained buoyant. The latest inflation data confirmed the need for more rate hikes from the Fed. The COT report showed that non-commercial long positions dropped by 8,666 to 250,070, and non-commercial short positions increased by 4,687 to 76,334. The overall non-commercial net position came in at 185,045 versus 187,089. The weekly closing price fell to 1.0793 from 1.0889.
Indicator signals:
Moving Averages
Trading is around the 30 and 50 daily moving averages, indicating a possible upward correction in the pair.
Please note that the time period and levels of the moving averages are analyzed only for the H1 chart, which differs from the general definition of the classic daily moving averages on the D1 chart.
Bollinger Bands
If the pair falls, the lower band of the indicator at 1.0695 will act as support.
Description of indicators:
• A moving average of a 50-day period determines the current trend by smoothing volatility and noise; marked in yellow on the chart;
• A moving average of a 30-day period determines the current trend by smoothing volatility and noise; marked in green on the chart;
• MACD Indicator (Moving Average Convergence/Divergence) Fast EMA with a 12-day period; Slow EMA with a 26-day period. SMA with a 9-day period;
• Bollinger Bands: 20-day period;
• Non-commercial traders are speculators such as individual traders, hedge funds, and large institutions who use the futures market for speculative purposes and meet certain requirements;
• Long non-commercial positions represent the total number of long positions opened by non-commercial traders;
• Short non-commercial positions represent the total number of short positions opened by non-commercial traders;
• The non-commercial net position is the difference between short and long positions of non-commercial traders.