empty
31.05.2023 09:53 AM
GBP/USD trading plan for European session on May 31, 2023. COT report and overview of yesterday's trades. The pound is trying to continue the correction

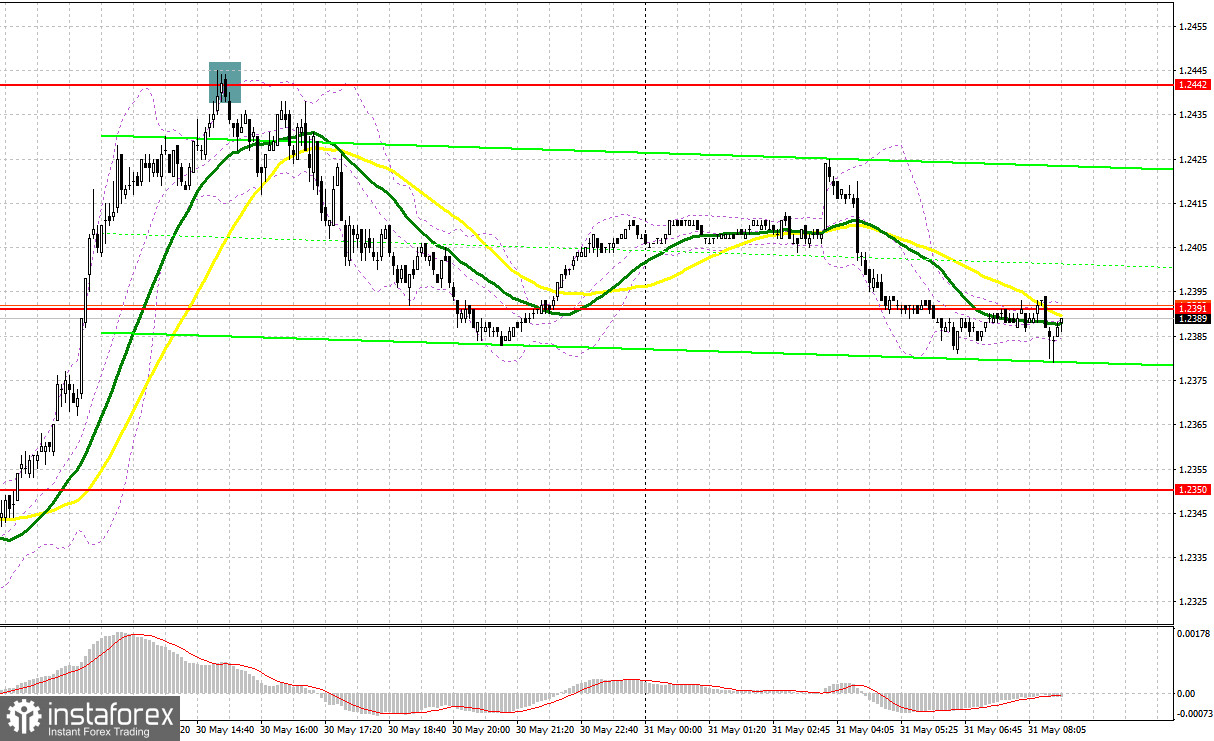
Yesterday, there were some great signals to enter the market. Let's have a look at the 5-minute chart and see what happened there. In my morning review, I mentioned the level of 1.2351 as a possible entry point. A breakthrough through the mark without the downward test produced no signal. In the afternoon, after a sharp rise to 1.2442, a false breakout at this mark produced an excellent sell signal. As a result, the pair fell by more than 50 pips.

This image is no longer relevant

For long positions on GBP/USD:

There are no UK reports today, so we can expect traders to start working off the good news on the agreement to raise the US debt limit and bears will take profits, which will lead to a further upward correction. It is unlikely for Bank of England's ILC member Catherine L. Mann to say anything new, so her speech will not have much effect on the GBP/USD pair's direction.

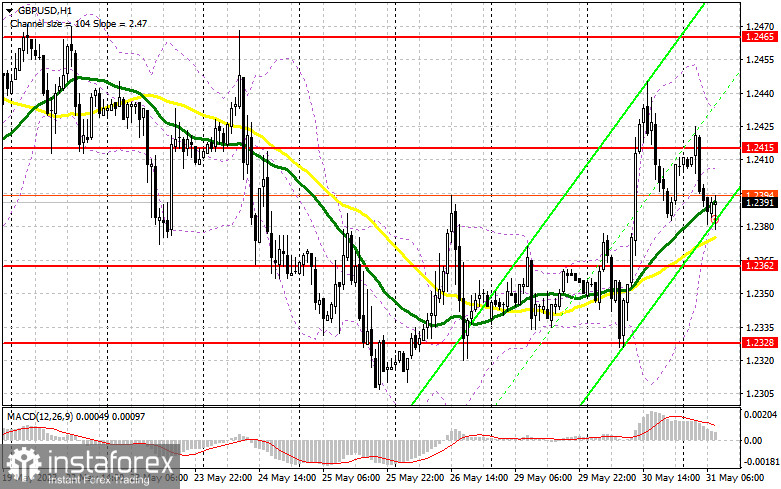
I will consider buying only after a decline and if traders manage to protect an important support at 1.2362, above which the moving averages playing on the bulls' side pass. A false breakout on that mark will produce a buy signal, targeting 1.2415, a new resistance level, which was formed yesterday. A breakout and consolidation above this range will produce another buy signal and push the pair to 1.2465. The most distant target stands at 1.2506, where I will lock in profit.

If GBP/USD declines and there are no bulls at 1.2362, the bearish sentiment will persist. In that case, the bulls' last hope will be protecting yesterday's low at 1.2328, but only after a false breakout. I will buy GBP/USD on a rebound from 1.2275, allowing a correction of 30-35 pips intraday.

For short positions on GBP/USD:

Yesterday, the bulls struck quite a powerful blow to the bears' stop-orders after news about UK inflation remaining at a rather high level. Therefore, I would expect new sellers to appear around the new resistance level of 1.2415. A failed consolidation above that range will produce a sell signal, and the pair could fall to 1.2362, an important support level, which can change the balance of forces. A breakout and an upside retest of this range will create a sell entry point with the target at 1.2328. The most distant target stands at 1.2275, where I will lock in profit.

If GBP/USD goes up and there is no bearish activity at 1.2415, it is better to hold back from short positions until the test of a larger resistance at 1.2465. In such a case, a false breakout through this mark will create a sell entry point. If there is no activity there either, I will sell GBP/USD at 1.2506, allowing a bearish correction of 30-35 pips intraday.

This image is no longer relevant

COT report:

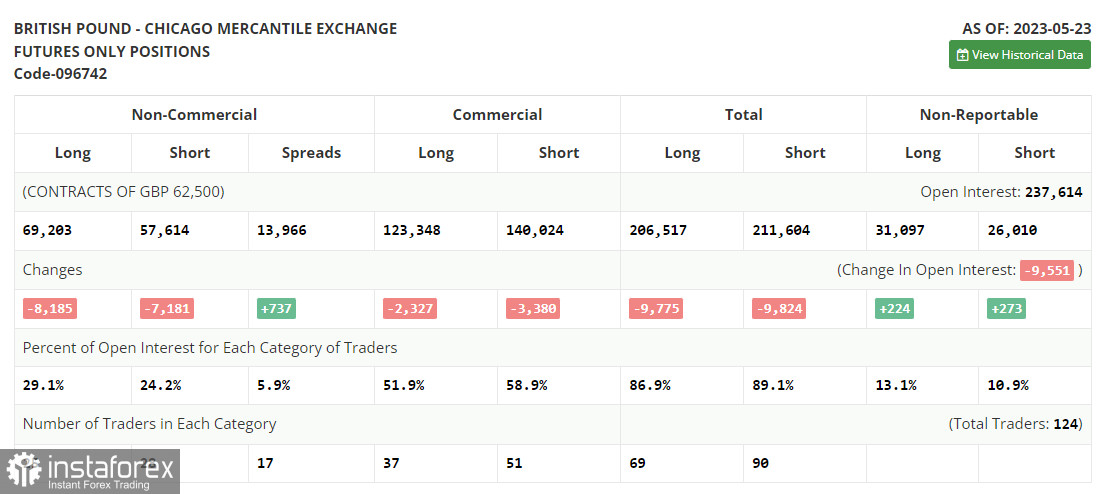
According to the COT report for May 23, the number of long and short positions decreased. Last week, the pound was bearish. Fearing a default and a recession in the US, traders had to close positions, especially in the face of uncertainty surrounding the Bank of England's monetary policy stance. The regulator hinted at a pause in rate hikes. However, with high inflationary pressures in the UK, it seems unlikely. The COT report showed that non-commercial short positions dropped by 7,181 to 57,614, and non-commercial long positions fell by 8,185 to 69,203. The overall non-commercial net position came in at 11,059 versus 12,593 a week earlier. The weekly closing price fell to 1.2425 from 1.2495.

This image is no longer relevant

Indicator signals:

Moving Averages

Trading is around the 30 and 50-day moving averages, indicating that the bulls are trying to extend the correction.

Please note that the time period and levels of the moving averages are analyzed only for the H1 chart, which differs from the general definition of the classic daily moving averages on the D1 chart.

Bollinger Bands

If the pair falls, the lower band of the indicator at 1.2380 will act as support.

Description of indicators:

• A moving average of a 50-day period determines the current trend by smoothing volatility and noise; marked in yellow on the chart;

• A moving average of a 30-day period determines the current trend by smoothing volatility and noise; marked in green on the chart;

• MACD Indicator (Moving Average Convergence/Divergence) Fast EMA with a 12-day period; Slow EMA with a 26-day period. SMA with a 9-day period;

• Bollinger Bands: 20-day period;

• Non-commercial traders are speculators such as individual traders, hedge funds, and large institutions who use the futures market for speculative purposes and meet certain requirements;

• Long non-commercial positions represent the total number of long positions opened by non-commercial traders;

• Short non-commercial positions represent the total number of short positions opened by non-commercial traders;

• The non-commercial net position is the difference between short and long positions of non-commercial traders.

Miroslaw Bawulski,
Analytical expert of InstaForex
© 2007-2025
Select timeframe
5
min
15
min
30
min
1
hour
4
hours
1
day
1
week
Earn on cryptocurrency rate changes with InstaForex
Download MetaTrader 4 and open your first trade
  • Grand Choice
    Contest by
    InstaForex
    InstaForex always strives to help you
    fulfill your biggest dreams.
    JOIN CONTEST

Recommended Stories

How to Trade the GBP/USD Pair on May 23? Simple Tips and Trade Analysis for Beginners

Analysis of Thursday's Trades 1H Chart of GBP/USD The GBP/USD pair didn't even attempt a correction on Thursday. While the euro faced bearish pressure from weak business activity indices

Paolo Greco 05:58 2025-05-23 UTC+2

How to Trade the EUR/USD Pair on May 23? Simple Tips and Trade Analysis for Beginners

Analysis of Thursday's Trades 1H Chart of EUR/USD On Thursday, the EUR/USD currency pair corrected to the nearest support level on the hourly timeframe, which was at 1.1267. Multiple factors

Paolo Greco 05:57 2025-05-23 UTC+2

Trading Recommendations and Analysis for GBP/USD on May 23: Pound Prepares for a Historic Breakout

The GBP/USD currency pair broke out of its sideways channel through the upper boundary, but it is in no hurry to continue rising. Traders appear to be gathering momentum

Paolo Greco 03:43 2025-05-23 UTC+2

Trading Recommendations and Analysis for EUR/USD on May 23: The Euro Couldn't Withstand the Pressure

On Thursday, the EUR/USD currency pair traded lower, which can be considered an exception to the general trend. Nearly all macroeconomic reports during the day were unfavorable for the euro

Paolo Greco 03:43 2025-05-23 UTC+2

How to Trade the GBP/USD Pair on May 22? Simple Tips and Trade Analysis for Beginners

Analysis of Wednesday's Trades 1H Chart of GBP/USD The GBP/USD pair maintained its upward trend on Wednesday, a movement that has developed over the past two weeks. Recall that

Paolo Greco 06:31 2025-05-22 UTC+2

How to Trade the EUR/USD Pair on May 22? Simple Tips and Trade Analysis for Beginners

Analysis of Wednesday's Trades 1H Chart of EUR/USD On Wednesday, the EUR/USD currency pair continued its upward movement calmly and steadily. The price broke through the 1.1267 level, which

Paolo Greco 06:31 2025-05-22 UTC+2

Trading Recommendations and Analysis for GBP/USD on May 22: The Pound Breaks Through Key Levels

The GBP/USD currency pair also resumed its upward movement on Wednesday. The rise of the British pound, which in reality still reflects the fall of the US dollar, began overnight

Paolo Greco 03:30 2025-05-22 UTC+2

Trading Recommendations and Analysis for EUR/USD on May 22: Reasons Don't Matter and Aren't Needed

The EUR/USD currency pair resumed its upward movement on Wednesday, and it is now safe to say that the uptrend is present not only in the hourly timeframe but also

Paolo Greco 03:30 2025-05-22 UTC+2

How to Trade the GBP/USD Pair on May 21? Simple Tips and Trade Analysis for Beginners

Analysis of Tuesday's Trades 1H Chart of GBP/USD The GBP/USD pair mainly traded sideways on Tuesday, but early Wednesday morning it surged upward. On the 4-hour timeframe, it's clear that

Paolo Greco 06:17 2025-05-21 UTC+2

How to Trade the EUR/USD Pair on May 21? Simple Tips and Trade Analysis for Beginners

Analysis of Tuesday's Trades 1H Chart of EUR/USD On Tuesday, the EUR/USD currency pair traded sideways, but it resumed its upward movement early Wednesday morning. This indicates that the ongoing

Paolo Greco 06:17 2025-05-21 UTC+2
Can't speak right now?
Ask your question in the chat.
Widget callback
 

Dear visitor,

Your IP address shows that you are currently located in the USA. If you are a resident of the United States, you are prohibited from using the services of InstaFintech Group including online trading, online transfers, deposit/withdrawal of funds, etc.

If you think you are seeing this message by mistake and your location is not the US, kindly proceed to the website. Otherwise, you must leave the website in order to comply with government restrictions.

Why does your IP address show your location as the USA?

  • - you are using a VPN provided by a hosting company based in the United States;
  • - your IP does not have proper WHOIS records;
  • - an error occurred in the WHOIS geolocation database.

Please confirm whether you are a US resident or not by clicking the relevant button below. If you choose the wrong option, being a US resident, you will not be able to open an account with InstaForex anyway.

We are sorry for any inconvenience caused by this message.