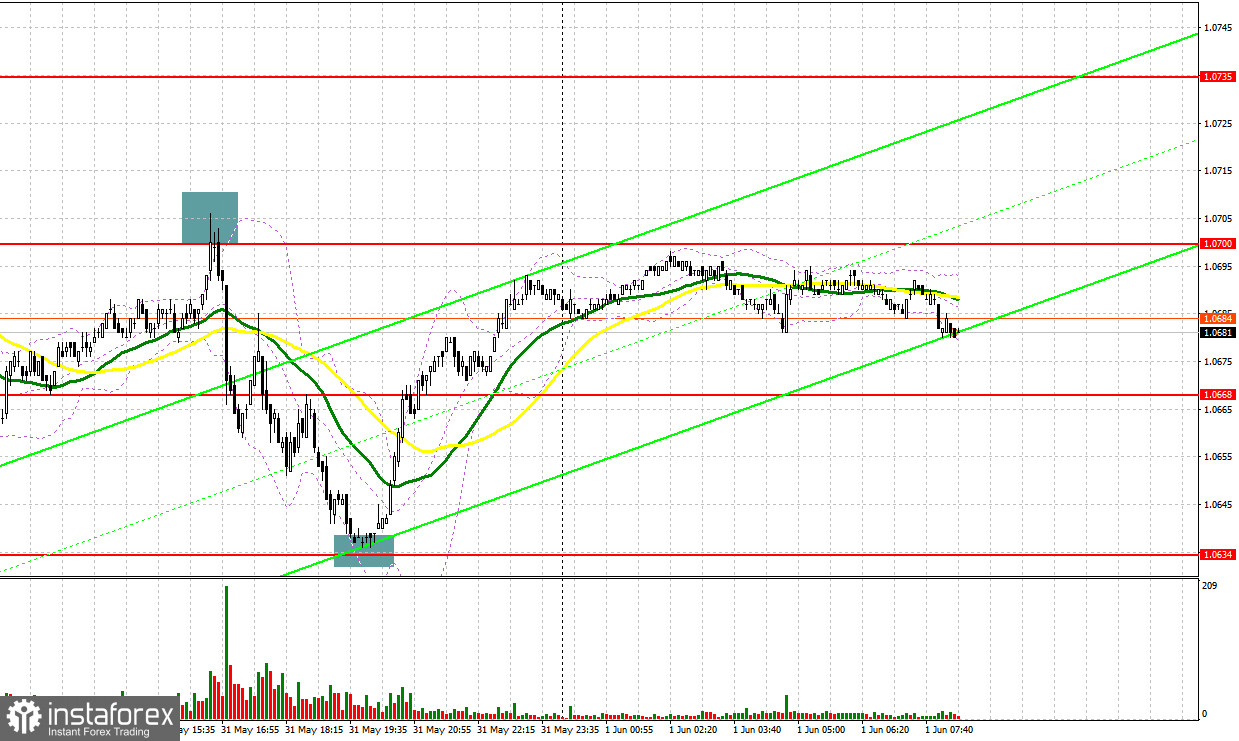
Yesterday, there were several signals to enter the market. Let's look at the 5-minute chart and figure out what happened. Previously, I considered entering the market from 1.0674. A decline and false breakout on this mark produced a buy signal. However, the pair did not rise. As a result, it was necessary to fix losing trades. In the second half of the day, a false breakout at 1.0700 produced a sell signal, and the pair fell by more than 70 points. You could take around 50 pips more from buying around 1.0634.
For long positions on EUR/USD:
Some Federal Reserve officials have been hinting that the US central bank could skip raising interest rates in June. This statement has made it possible for euro buyers to compensate for some losses, which they incurred at the end of Wednesday. News that the House of Representatives passed a bill to raise the debt ceiling on Wednesday also had a positive effect on demand for risky assets. Today a lot will depend on eurozone core CPI and unemployment data. If eurozone inflation slows down even more, the pressure on the euro will come back.
Therefore, I will buy only after a fall and a false breakout through the new intermediate support level of 1.0666. A sharp growth and hawkish comments from European Central Bank President Christine Lagarde will push the euro up against the bearish trend which will give us a chance to enter long positions at the beginning of the month. If things turn upbeat, EUR/USD will rise to 1.0700 resistance, which is in line with the bearish moving averages. A breakout and a downside test of this mark may strengthen the demand for the euro later in the afternoon and generate another buy entry point with the target around the 1.0735 high. The most distant target is seen at 1.0766 where I will lock in profits.
If there is no bullish activity at 1.0666, which is very likely at the beginning of this month, we can expect further trend development. A false breakout through 1.0634 support will generate a buy signal. I will open long positions from the low of 1.0595, allowing a bullish correction of 30-35 pips intraday.
For short positions on EUR/USD:
The market is balanced for the time being, but sellers are in control of the market. Traders should protect the nearest resistance level at 1.0700. This is a good chance to go short in continuation of yesterday's trend. Considering that the eurozone data might weaken the bulls' position, a false breakout at 1.0700 will produce a sell signal that might push the pair to the support level of 1.0666. In case of consolidation below this range and its retest to the upside, the price will head toward 1.0634. The most distant target is seen at the low of 1.0595 where I will lock in profits.
If EUR/USD goes up in the European session and there is no bearish activity at 1.0700, profit taking at the beginning of the month may lead to a sharp surge. Therefore, I will sell the instrument at 1.0735 after failed consolidation. I will also consider selling on a bounce from the high of 1.0766, allowing a bearish correction of 30-35 pips.
COT report:
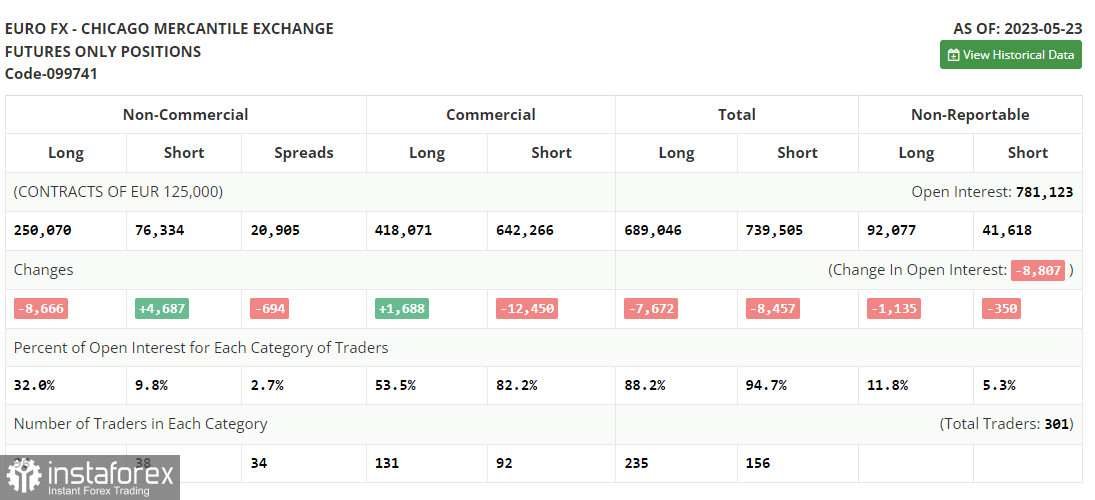
According to the COT report for May 23, long positions decreased and short positions grew. The euro extended the fall because the US debt ceiling was then a burning issue and recession risks were high. However, even when the debt limit deal was reached, demand for the greenback remained buoyant. The latest inflation data confirmed the need for more rate hikes from the Fed. The COT report showed that non-commercial long positions dropped by 8,666 to 250,070, and non-commercial short positions increased by 4,687 to 76,334. The overall non-commercial net position came in at 185,045 versus 187,089. The weekly closing price fell to 1.0793 from 1.0889.
Indicator signals:
Moving Averages
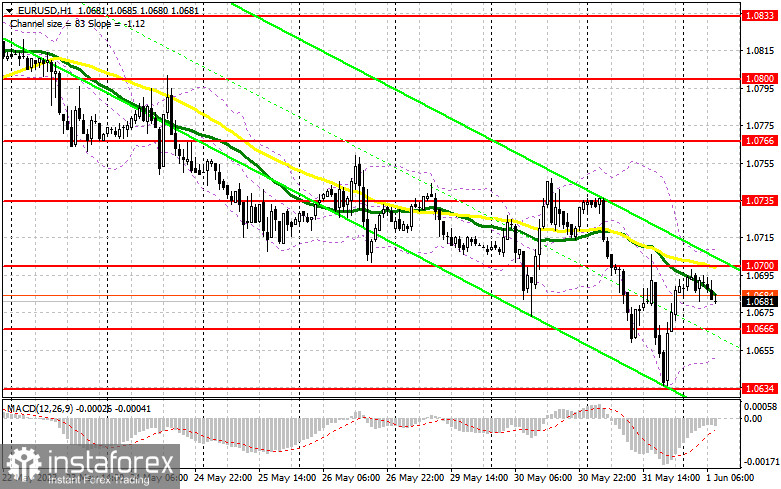
Trading is around the 30 and 50-day moving averages, indicating a possible upward correction.
Please note that the time period and levels of the moving averages are analyzed only for the H1 chart, which differs from the general definition of the classic daily moving averages on the D1 chart.
Bollinger Bands
If the pair falls, the lower band of the indicator at 1.0650 will act as support.
Description of indicators:
• A moving average of a 50-day period determines the current trend by smoothing volatility and noise; marked in yellow on the chart;
• A moving average of a 30-day period determines the current trend by smoothing volatility and noise; marked in green on the chart;
• MACD Indicator (Moving Average Convergence/Divergence) Fast EMA with a 12-day period; Slow EMA with a 26-day period. SMA with a 9-day period;
• Bollinger Bands: 20-day period;
• Non-commercial traders are speculators such as individual traders, hedge funds, and large institutions who use the futures market for speculative purposes and meet certain requirements;
• Long non-commercial positions represent the total number of long positions opened by non-commercial traders;
• Short non-commercial positions represent the total number of short positions opened by non-commercial traders;
• The non-commercial net position is the difference between short and long positions of non-commercial traders.