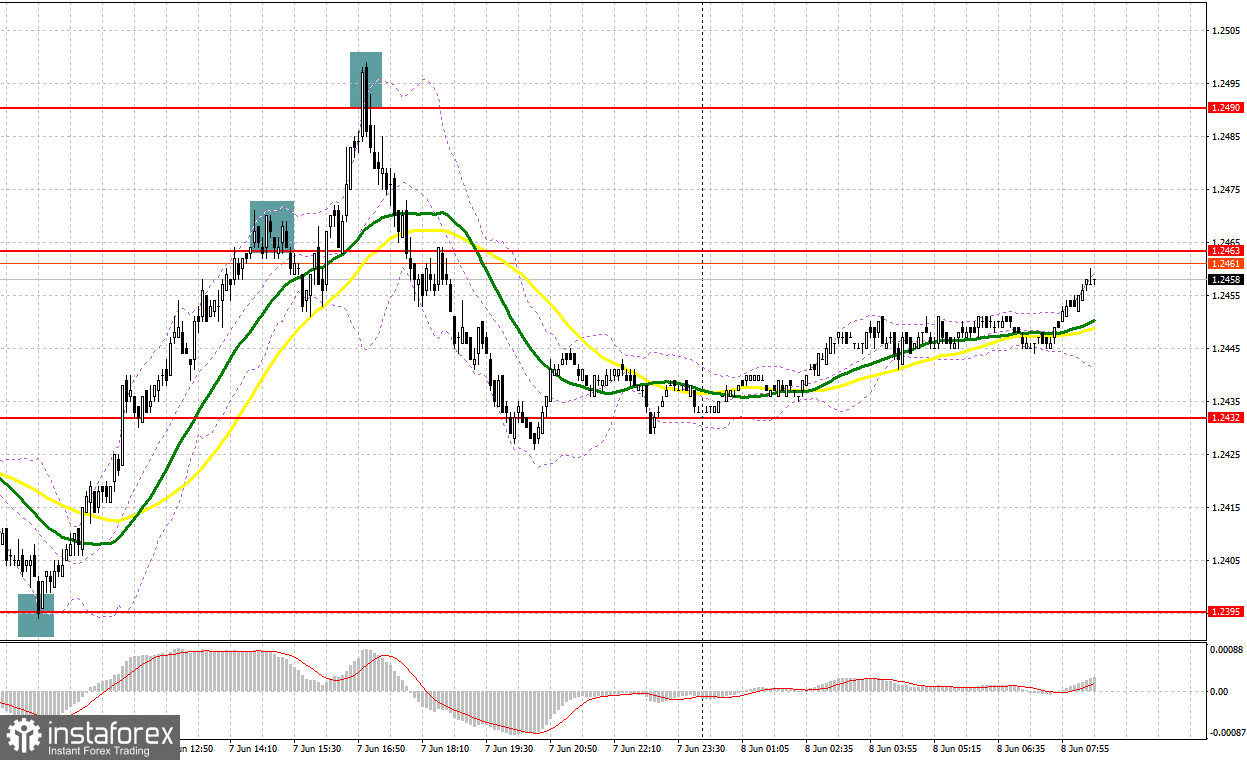
Yesterday, there were several entry points. Now let's look at the 5-minute chart and try to figure out what actually happened. In the morning article, I highlighted the level of 1.2395 and recommended taking decisions with this level in focus. A decline and a false breakout of this level gave an excellent buy signal, which resulted in an increase of more than 80 pips. In the afternoon, the protection of 1.2463 and the sell signal led to losses, while short positions from 1.2490 brought about 60 pips.
When to open long positions on GBP/USD:
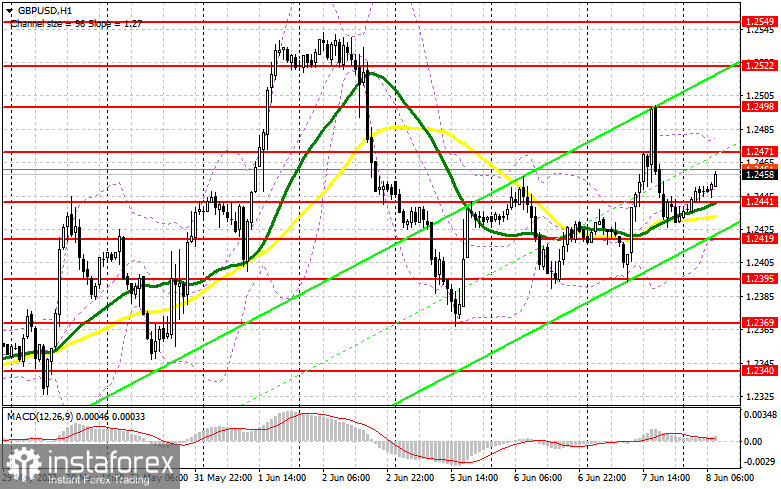
The economic calendar for the US is completely uneventful today. It might help the pound sterling recover versus the US dollar. To do so, bulls need to protect the support level of 1.2441. If they fail to defend this level, the pound sterling will hardly grow higher. A false breakout there may give an entry point into long positions in the continuation of the bullish market. The pair could reach the resistance level of 1.2471. It will be extremely hard to break through this level. A breakout and consolidation above this level could create an additional buy signal with a jump to a weekly high of 1.2498. A more distant target will be the 1.2522 level where I recommend locking in profits.
If it declines to 1.2441 and bulls show no activity, the pressure on the pound sterling will increase. The moving averages are passing in positive territory at this level. In this case, only the protection of 1.2419 and a false breakout of this level will give new entry points into long positions. You could buy GBP/USD at a bounce from 1.2395, keeping in mind an upward intraday correction of 30-35 pips.
When to open short positions on GBP/USD:
The bears managed to regain ground yesterday. They need to push the pair below 1.2441. It is better to sell the pound sterling on a rebound after the test of the resistance level of 1.2471. At this level, sellers are likely to return to the market. Only after an unsuccessful consolidation above this level will generate a sell signal. The pair could decline to 1.2441. A breakout and an upward retest of this level may occur only after strong US labor market data. We will talk about it in the afternoon. These factors will escalate pressure on GBP/USD, giving a sell signal with a drop to 1.2419. A more distant target will be the 1.2395 level where I recommend locking in profits.
If GBP/USD rises and bears fail to defend 1.2471, the bullish trend of GBP/ USD may persist. In this case, I would advise you to postpone short positions until a breakout of a weekly high of 1.2498. Traders have already opened short positions at this level today. If there is no downward movement there, you could sell GBP/USD at a bounce from 1.2522, bearing in mind a downward intraday correction of 30-35 pips.
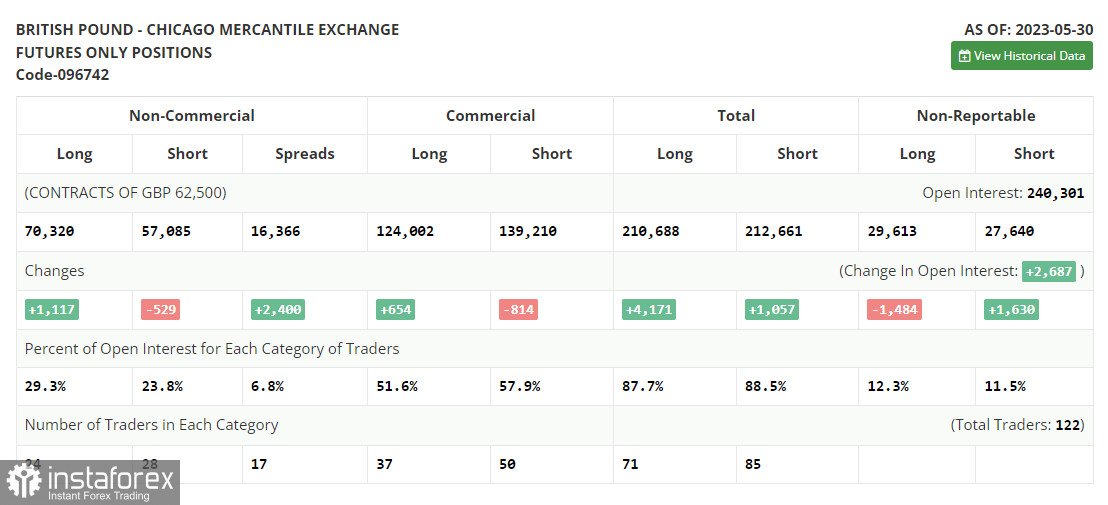
The COT report (Commitment of Traders) for May 30 showed a drop in short positions and an increase in long positions. The pound experienced a significant decline, but decent statistics released last week helped to halt the decline and partially recoup losses suffered in May. However, expectations that the Federal Reserve will continue to raise interest rates are capping the pair's upside potential. Despite the central bank's pause in June, an overheated labor market will not allow the committee to halt the cycle of tightening monetary policy for long. Further uncertainty about the BoE's monetary policy will exert pressure on the British pound. According to the last COT report, short non-commercial positions decreased by 529 to 57,085, while long non-commercial positions increased by 1,117 to 70,320. This led to an increase in the non-commercial net position to 13,235 from 11,059 a week earlier. The weekly price decreased to 1.2398 from 1.2425.
Indicators' signals:
Trading is carried out near the 30 and 50 daily moving averages, which indicates sideways movement.
Moving averages
Note: The period and prices of moving averages are considered by the author on the H1 (1-hour) chart and differ from the general definition of the classic daily moving averages on the daily D1 chart.
Bollinger Bands
If GBP/USD declines, the indicator's lower border at 1.1365 will serve as support.
Description of indicators
- Moving average (moving average, determines the current trend by smoothing out volatility and noise). Period 50. It is marked yellow on the chart.
- Moving average (moving average, determines the current trend by smoothing out volatility and noise). Period 30. It is marked green on the chart.
- MACD indicator (Moving Average Convergence/Divergence - convergence/divergence of moving averages) Quick EMA period 12. Slow EMA period to 26. SMA period 9
- Bollinger Bands (Bollinger Bands). Period 20
- Non-commercial speculative traders, such as individual traders, hedge funds, and large institutions that use the futures market for speculative purposes and meet certain requirements.
- Long non-commercial positions represent the total long open position of non-commercial traders.
- Short non-commercial positions represent the total short open position of non-commercial traders.
- Total non-commercial net position is the difference between the short and long positions of non-commercial traders.