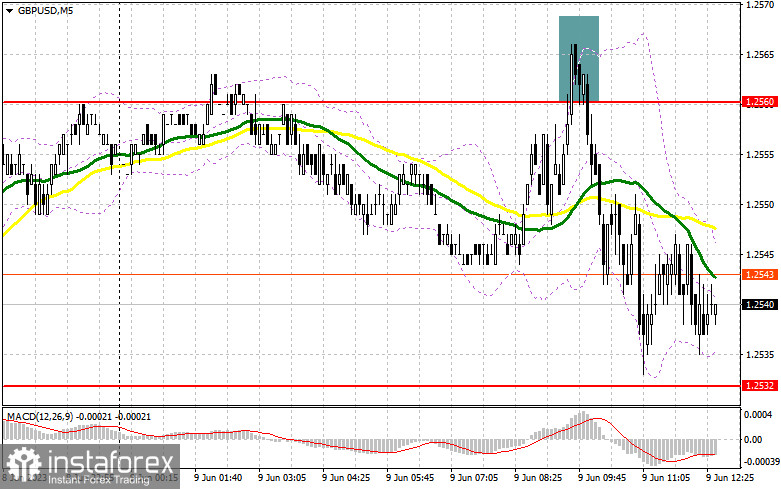
In my morning forecast, I emphasized the level of 1.2560 and recommended making entry decisions based on it. Let's look at the 5-minute chart and analyze what happened there. Active resistance from sellers at 1.2560 allowed for entering short positions, leading to a decrease in GBP/USD by almost 30 points. The technical picture remained unchanged for the second half of the day.
To open long positions on GBP/USD, the following is required:
Considering the lack of statistics, I advise acting based on the nearest support level of 1.2532, where buyers should show themselves if they are still in the market after yesterday's rally. A false breakout at 1.2532 will signal a buy opportunity with the prospect of a new upward surge toward the resistance at 1.2560, which was not broken today, even on the second attempt. Only a breakthrough and a subsequent top-down retest of this range will provide an additional signal to open long positions, reinforcing the presence of bulls with a move towards 1.2583, which will restore the upward trend. The ultimate target will be around 1.2611, where I will take profits.
In the scenario of a pound decline towards 1.2532 and a complete lack of activity from buyers, pressure on the pair will return, and bears will have an excellent chance to negate yesterday's growth. In this case, I will postpone entering the market until the support at 1.2506, where the moving averages are located, playing on the bulls' side. I will only open long positions there on a false breakout. I plan to buy GBP/USD on a bounce from 1.2478, aiming for a 30-35 points correction within the day.
To open short positions on GBP/USD, the following is required:
Sellers attempted to reenter the market in the first half of the day, and they succeeded. Today, we can expect a larger downward correction of the pound, but it is necessary to break below 1.2532. However, in the absence of important fundamental statistics, I prefer to open new short positions on rallies only near the resistance at 1.2560, similar to what I discussed earlier. A false breakout there will be a signal to sell, providing a chance for a downward move toward the support at 1.2532. A breakthrough and a subsequent bottom-up retest of this range will bring back a bearish market sentiment, canceling all the growth and forming a signal to open short positions with a decline towards 1.2506. The ultimate target remains at least 1.2478, where I will take profits.
If GBP/USD continues to rise and there is no activity at 1.2560 (already tested twice), buyers will attempt to reenter the market, expecting to establish a new bullish trend. In that case, I will postpone selling until the resistance at 1.2583 is tested. A false breakout there will be the entry point for short positions. I plan to sell GBP/USD on a bounce from 1.2611, but only in anticipation of a downward correction of the pair by 30-35 points within the day.
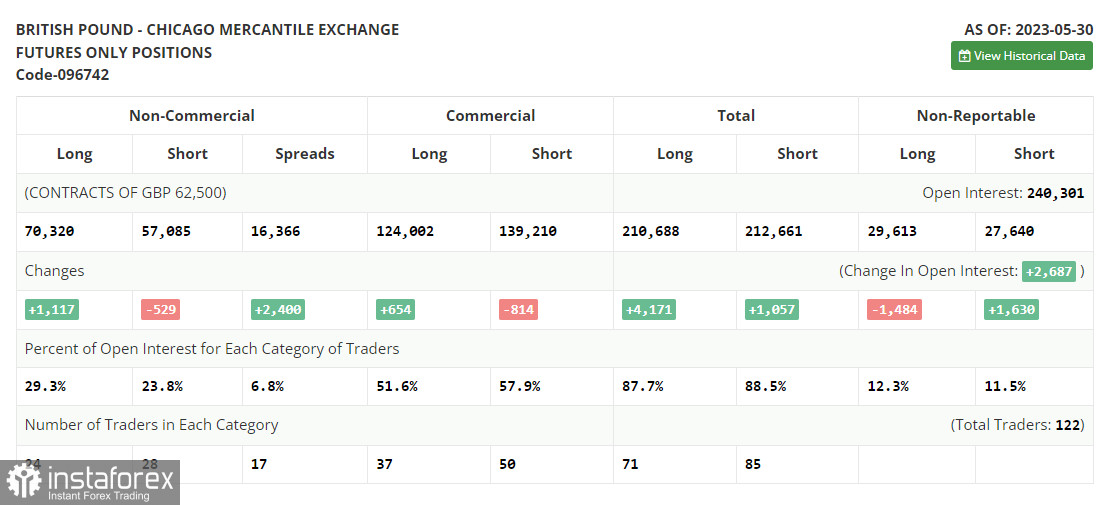
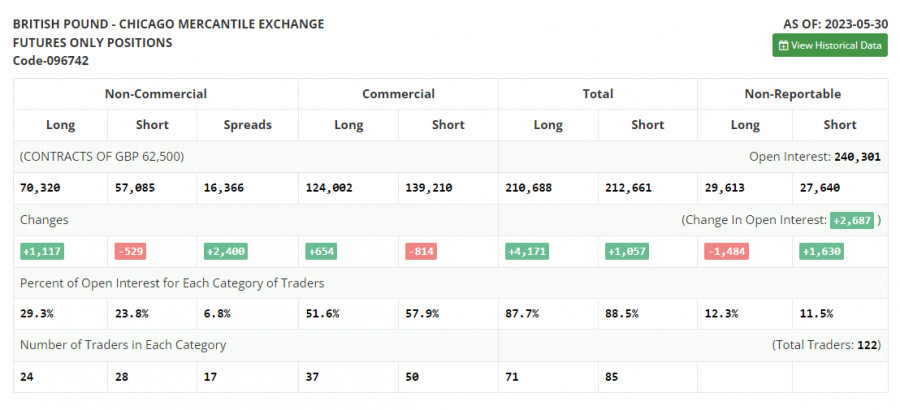
The COT report (Commitment of Traders) for May 30th showed a decrease in short positions and an increase in long positions. The pound experienced a significant decline, but good statistics released last week helped stop the fall and partially compensate for the losses in May. However, the expectation that the Federal Reserve will continue to raise interest rates limits the pound's upward potential. Despite the pause in June from the central bank, the overheated labor market will only allow the committee to halt the cycle of monetary policy tightening for a short time. Faced with further uncertainty from the Bank of England regarding monetary policy, this will exert clear pressure on the British pound. According to the latest COT report, short non-commercial positions decreased by 529 to 57,085, while long non-commercial positions increased by 1,117 to 70,320. This led to an increase in the non-commercial net position to 13,235 compared to 11,059 the previous week. The weekly price decreased to 1.2398 from 1.2425.
Indicator signals:
Moving Averages
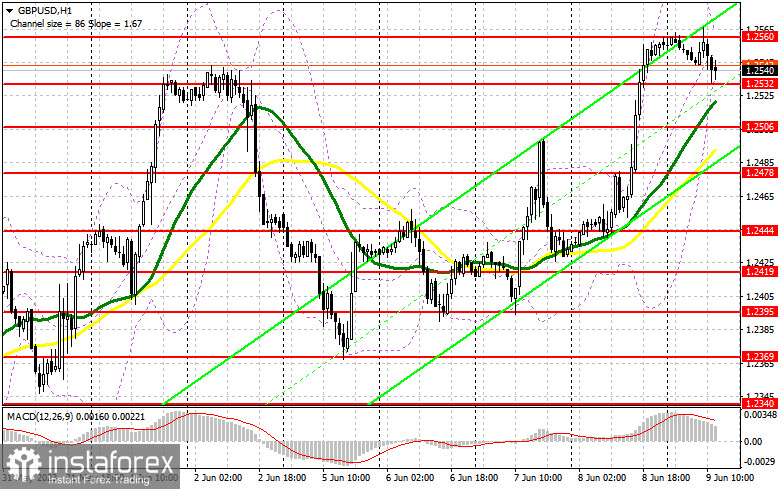
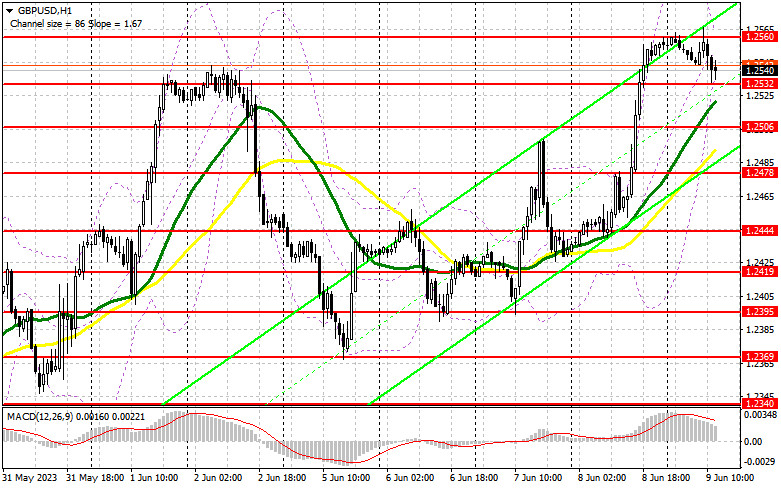
Trading is conducted above the 30 and 50-day moving averages, indicating further pair growth.
Note: The author considers the period and prices of the moving averages on the hourly chart (H1), which differs from the general definition of classical daily moving averages on the daily chart (D1).
Bollinger Bands
In case of a decline, the lower boundary of the indicator, around 1.2530, will act as support.
Description of Indicators:
- Moving Average (determines the current trend by smoothing out volatility and noise). Period 50. Marked in yellow on the chart.
- Moving Average (determines the current trend by smoothing out volatility and noise). Period 30. Marked in green on the chart.
- MACD Indicator (Moving Average Convergence/Divergence - measures the convergence and divergence of moving averages). Fast EMA period 12. Slow EMA period 26. SMA period 9.
- Bollinger Bands. Period 20.
- Non-commercial traders - speculators such as individual traders, hedge funds, and large institutions using the futures market for speculative purposes and meeting certain requirements.
- Long non-commercial positions represent the total long open positions of non-commercial traders.
- Short non-commercial positions represent the total short open positions of non-commercial traders.
- The non-commercial net position is the difference between non-commercial traders' short and long positions.